
Page 75 - GHES-3-2
P. 75
Global Health Economics and
Sustainability
Climate change and quality of life
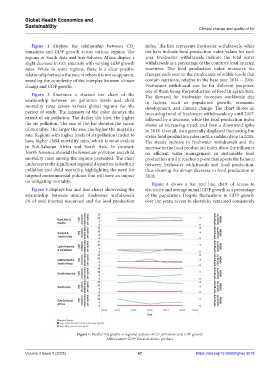
Figure 1 displays the relationship between CO index. The line represents freshwater withdrawals, while
2
emissions and GDP growth across various regions. The the bars indicate food production index values for each
regions of South Asia and Sub-Saharan Africa display a year. Freshwater withdrawals indicate the total water
slight decrease in CO intensity with varying GDP growth withdrawals as a percentage of the country’s total internal
2
rates. While in some regions, there is a clear positive resources. The food production index measures the
relationship between the two; in others it is not so apparent, changes each year in the production of edible foods that
revealing the complexity of the interplay between climate contain nutrients, relative to the base year 2014 – 2016.
change and GDP growth. Freshwater withdrawal can be for different purposes,
one of them being the production of food in agriculture.
Figure 2 illustrates a stacked bar chart of the The demand for freshwater increases worldwide due
relationship between air pollution levels and child to factors, such as population growth, economic
mortality rates across various global regions for the development, and climate change. The chart shows an
period of study. The intensity of the color denotes the increasing trend of freshwater withdrawals up until 2017,
extent of air pollution. The darker the blue, the higher followed by a decrease, while the food production index
the air pollution. The size of the bar denotes the extent shows an increasing trend, and then a downward spike
of mortality. The larger the size, the higher the mortality in 2018. Overall, data generally displayed fluctuating but
rate. Regions with higher levels of air pollution tended to stable food production rates until a sudden drop in 2018.
have higher child mortality rates, which is most evident The steady increase in freshwater withdrawals and the
in Sub-Saharan Africa and South Asia. In contrast, increase in the food production index show the influence
North America showed the lowest air pollution and child on efficient water management in sustainable food
mortality rates among the regions presented. The chart production until it reaches a point that upsets the balance
underscores the significant regional disparities in both air between freshwater withdrawals and food production,
pollution and child mortality, highlighting the need for thus showing the abrupt decrease in food production in
targeted environmental policies that will have an impact 2018.
on mitigating mortality. Figure 4 shows a bar and line chart of access to
Figure 3 displays bar and line charts showcasing the electricity and average annual GDP growth as a percentage
relationship between annual freshwater withdrawals of the population. Despite fluctuations in GDP growth
(% of total internal resources) and the food production over the years, access to electricity remained consistently
Figure 1. Parallel line graphs of regional analysis of CO emissions and GDP growth
2
Abbreviation: GDP: Gross domestic product.
Volume 3 Issue 2 (2025) 67 https://doi.org/10.36922/ghes.5018