
Page 80 - GHES-3-2
P. 80
Global Health Economics and
Sustainability
Climate change and quality of life
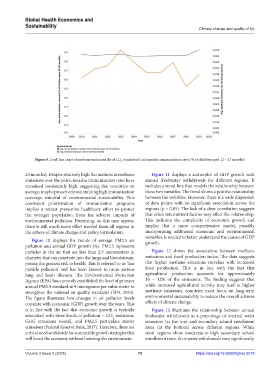
Figure 9. Dual-line chart of methane emissions (kt of CO equivalent) and measles immunization rates (% of children aged 12 – 23 months)
2
23 months). Despite relatively high fluctuations in methane Figure 11 displays a scatterplot of GDP growth with
emissions over the years, measles immunization rates have annual freshwater withdrawals for different regions. It
remained consistently high, suggesting that countries on includes a trend line that models the relationship between
average, may be proactively maintaining high immunization these two variables. The trend shows a positive relationship
coverage, mindful of environmental sustainability. This between the variables. However, there is a wide dispersion
consistent prioritization of immunization programs of data points with no significant association across the
implies a robust preventive healthcare effort to protect regions (p > 0.05). The lack of a clear correlation suggests
the younger population from the adverse impacts of that other intermittent factors may affect the relationship.
environmental pollution. Promising, as this may appear, This indicates the complexity of economic growth and
there is still much more effort needed from all regions in implies that a more comprehensive model, possibly
the sphere of climate change and policy formulation. incorporating additional economic and environmental
variables, is needed to better understand the causes of GDP
Figure 10 displays the trends of average PM2.5 air growth.
pollution and annual GDP growth (%). PM2.5 represents
particles in the air that are less than 2.5 micrometers in Figure 12 shows the association between methane
diameter that can penetrate into the lungs and bloodstream, emissions and food production index. The data suggests
posing the greatest risk to health. This is referred to as ‘fine that higher methane emissions correlate with increased
particle pollution’ and has been known to cause serious food production. This is in line with the fact that
lung and heart diseases. The Environmental Protection agricultural production accounts for approximately
Agency (EPA) has currently established the level of primary 10 – 12% of the emissions. The finding suggests that
annual PM2.5 standard at 9 micrograms per cubic meter to while increased agricultural activity may lead to higher
strengthen the national air quality standards (EPA, 2024). methane emissions, countries must focus on long-term
The figure illustrates how changes in air pollution levels environmental sustainability to reduce the overall adverse
correlate with economic (GDP) growth over the years. This effects of climate change.
is in line with the fact that economic growth is typically Figure 13 illustrates the relationship between annual
associated with three kinds of pollution – CO emissions, freshwater withdrawals as a percentage of internal water
2
GHG emissions overall, and PM2.5 particulate matter resources (at the top) and secondary school enrollment
emissions (Federal Reserve Bank, 2017). Therefore, there is a rates (at the bottom) across different regions. While
critical need worldwide for sustainable growth strategies that most regions show moderate-to-high secondary school
will boost the economy without harming the environment. enrollment rates, their water withdrawals vary significantly,
Volume 3 Issue 2 (2025) 72 https://doi.org/10.36922/ghes.5018