
Page 76 - GHES-3-2
P. 76
Global Health Economics and
Sustainability
Climate change and quality of life
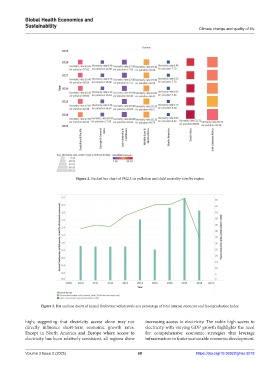
Figure 2. Stacked bar chart of PM2.5 air pollution and child mortality rates by region
Figure 3. Bar and line charts of annual freshwater withdrawals as a percentage of total internal resources and food production index
high; suggesting that electricity access alone may not increasing access to electricity. The stable high access to
directly influence short-term economic growth rates. electricity with varying GDP growth highlights the need
Except in North America and Europe where access to for comprehensive economic strategies that leverage
electricity has been relatively consistent, all regions show infrastructure to foster sustainable economic development.
Volume 3 Issue 2 (2025) 68 https://doi.org/10.36922/ghes.5018