
Page 79 - GHES-3-2
P. 79
Global Health Economics and
Sustainability
Climate change and quality of life
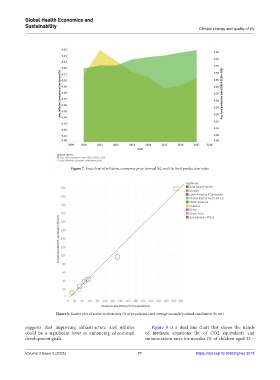
Figure 7. Area chart of inflation, consumer price (annual %), and the food production index
Figure 8. Scatter plot of access to electricity (% of population) and average secondary school enrollment (% net)
suggests that improving infrastructure and utilities Figure 9 is a dual line chart that shows the trends
could be a significant lever in enhancing educational of methane emissions (kt of CO2 equivalent) and
development goals. immunization rates for measles (% of children aged 12 –
Volume 3 Issue 2 (2025) 71 https://doi.org/10.36922/ghes.5018