
Page 81 - GHES-3-2
P. 81
Global Health Economics and
Sustainability
Climate change and quality of life
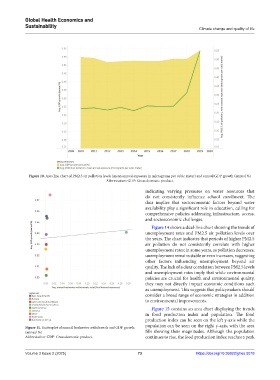
Figure 10. Area line chart of PM2.5 air pollution levels (mean annual exposure in micrograms per cubic meter) and annual GDP growth (annual %)
Abbreviation: GDP: Gross domestic product.
indicating varying pressures on water resources that
do not consistently influence school enrollment. The
data implies that socioeconomic factors beyond water
availability play a significant role in education, calling for
comprehensive policies addressing infrastructure, access,
and socioeconomic challenges.
Figure 14 shows a dual-line chart showing the trends of
unemployment rates and PM2.5 air pollution levels over
the years. The chart indicates that periods of higher PM2.5
air pollution do not consistently correlate with higher
unemployment rates; in some years, as pollution decreases,
unemployment remains stable or even increases, suggesting
other factors influencing unemployment beyond air
quality. The lack of a clear correlation between PM2.5 levels
and unemployment rates imply that while environmental
policies are crucial for health and environmental quality,
they may not directly impact economic conditions such
as unemployment. This suggests that policymakers should
consider a broad range of economic strategies in addition
to environmental improvements.
Figure 15 contains an area chart displaying the trends
in food production index and population. The food
production index can be seen on the left y-axis while the
population can be seen on the right y-axis, with the area
Figure 11. Scatterplot of annual freshwater withdrawals and GDP growth
(annual %) fills showing their magnitudes. Although the population
Abbreviation: GDP: Gross domestic product. continues to rise, the food production index reaches a peak
Volume 3 Issue 2 (2025) 73 https://doi.org/10.36922/ghes.5018