
Page 86 - GHES-3-2
P. 86
Global Health Economics and
Sustainability
Climate change and quality of life
pollution has on these health outcomes. The data suggests rates are lower. GDP growth is associated with increased
a significant public health challenge linked to air pollution, air pollution. On the other hand, there is no evidence of
emphasizing the need for enhanced environmental and a consistent correlation between air pollution and the
health policies to improve health outcomes, especially unemployment rate. Similarly, no association is observed
areas that have high pollution. between methane emissions and the unemployment rate.
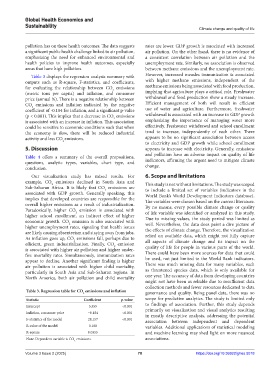
Table 3 displays the regression analysis summary with However, increased measles immunization is associated
outputs such as R-square, F-statistics, and coefficients, with higher methane emissions, independent of the
for evaluating the relationship between CO emissions methane emissions being associated with food production,
2
(metric tons per capita) and inflation, and consumer implying that agriculture plays a critical role. Freshwater
price (annual %). There is a negative relationship between withdrawal and food production show a steady increase.
CO emissions and inflation indicated by the negative Efficient management of both will result in efficient
2
coefficient of -0.184 for inflation, and a significant p-value use of water and agriculture. Furthermore, freshwater
(p < 0.001). This implies that a decrease in CO emissions withdrawal is associated with an increase in GDP growth
2
is associated with an increase in inflation. This association emphasizing the importance of managing water more
could be sensitive to economic conditions such that when effectively. Freshwater withdrawal and school enrollment
the economy is slow, there will be reduced industrial tend to increase, independently of each other. There
activity and less CO emissions. appears to be no significant association between access
2
to electricity and GDP growth while school enrollment
5. Discussion appears to increase with electricity. Generally, emissions
and pollution have an adverse impact on quality of life
Table 4 offers a summary of the overall propositions,
questions, analytic types, variables, chart type, and indicators, affirming the urgent need to mitigate climate
conclusion. change.
Our visualization study has mixed results. For 6. Scope and limitations
example, CO emissions declined in South Asia and This study is not without limitations. The study was scoped
2
Sub-Saharan Africa. It is likely that CO emissions are to include a limited set of variables (indicators in the
2
associated with GDP growth. Generally speaking, this World Bank’s World Development Indicators database).
implies that developed countries are responsible for the The variables were chosen based on the current literature.
overall higher emissions as a result of industrialization. By no means, every possible climate change or quality
Paradoxically, higher CO emission is associated with of life variable was identified or analyzed in this study.
2
higher school enrollment, an indirect effect of higher Due to missing values, the study period was limited as
economic growth. CO emission is also associated with well. Nevertheless, the data does paint a dire picture of
2
higher unemployment rates, signaling that health issues the effects of climate change. Therefore, the visualization
are likely causing absenteeism and staying away from jobs. relied on available data, which might not fully capture
As inflation goes up, CO emissions fall, perhaps due to all aspects of climate change and its impact on the
2
efficient, green industrialization. Finally, CO emission
2
is associated with higher air pollution and higher under- quality of life for people in various parts of the world.
five mortality rates. Simultaneously, immunization rates There could have been more sources for data that could
appear to decline. Another significant finding is higher be used, not just limited to the World Bank indicators.
air pollution is associated with higher child mortality, There was much missing data for many variables, such
particularly in South Asia and Sub-Saharan regions. In as threatened species data, which is only available for
North America, both air pollution and child mortality one year. The accuracy of data from developing countries
might not have been as reliable due to insufficient data
collection methods and fewer resources dedicated to data
Table 3. Regression table for CO emissions and inflation
2 governance and quality. Being panel data, there was no
Statistic Coefficient p‑value scope for predictive analytics. The study is limited only
Intercept 5.555 <0.001 to findings of association. Further, this study depends
Inflation, consumer price −0.184 <0.001 primarily on visualization and visual analytics resulting
in mostly descriptive analysis, addressing the potential
F-statistics of the model 28.157 <0.001 association between independent and dependent
R-value of the model 0.188 variables. Additional applications of statistical modeling
R-square 0.0355 and machine learning may shed light on more nuanced
Note: Dependent variable is CO emissions. associations.
2
Volume 3 Issue 2 (2025) 78 https://doi.org/10.36922/ghes.5018