
Page 88 - GHES-3-2
P. 88
Global Health Economics and
Sustainability
Climate change and quality of life
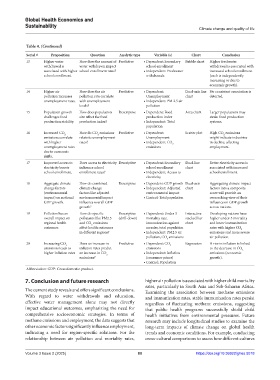
Table 4. (Continued)
Serial # Proposition Question Analytic type Variable (s) Chart Conclusion
13 Higher water How does the amount of Predictive • Dependent: Secondary Bubble chart Higher freshwater
withdrawal is water withdrawn impact school enrollment withdrawal is associated with
associated with higher school enrollment rates? • Independent: Freshwater increased school enrollment
school enrollment. withdrawals (each is independently
increasing or due to
economic growth).
14 Higher air How does the air Predictive • Dependent: Dual-axis line No consistent association is
pollution increases pollution rate correlate Unemployment chart detected.
unemployment rates. with unemployment • Independent: PM 2.5 air
levels? pollution
15 Population growth How does population Descriptive • Dependent: Food Area chart Larger populations may
challenges food size affect the food production index strain food production
production stability. production index? • Independent: Total systems.
population
16 Increased CO 2 How do CO emissions Predictive • Dependent: Scatter plot High CO emissions
2
2
emissions correlate relate to unemployment Unemployment might indicate industries
with higher rates? • Independent: CO 2 in decline, affecting
unemployment rates emissions employment.
due to economic
shifts.
17 Improved access to Does access to electricity Descriptive • Dependent: Secondary Dual-line Better electricity access is
electricity boosts influence school school enrollment chart associated with increased
school enrollment. enrollment rates? • Independent: Access to school enrollment.
electricity
18 Aggregate climate How do combined Descriptive • Dependent: GDP growth Dual-axis Aggregating climate impact
change factors climate change • Independent: Adjusted chart factors into a composite
(environmental factors like adjusted environmental impact score will provide an
impact) on national environmental impact • Control: Total population overarching view of their
GDP growth. influence overall GDP influence on GDP growth
growth? across nations.
19 Pollution has an How do specific Descriptive • Dependent: Under‑5 Interactive Developing nations have
overall impact on pollutants like PM2.5 (drill-down) mortality rate, stacked bar higher under-5 mortality
regional health and CO emissions immunization against chart and lower immunization
2
outcomes affect health outcomes measles, total population rates with higher CO 2
in different regions? • Independent: PM2.5 air emissions and more severe
pollution, CO emissions air pollution.
2
20 Increasing CO 2 Does an increase in Predictive • Dependent: CO 2 Regression A rise in inflation is linked
emissions leads to inflation rates predict emissions to the decrease in CO 2
higher inflation rates an increase in CO 2 • Independent: Inflation emissions (economic
emissions? (consumer prices) growth).
• Control: Population
Abbreviation: GDP: Gross domestic product.
7. Conclusion and future research higher air pollution is associated with higher child mortality
rates, particularly in South Asia and Sub-Saharan Africa.
The current study reveals and offers significant conclusions. Examining the association between methane emissions
With regard to water withdrawals and education, and immunization rates, stable immunization rates persist
effective water management alone may not directly regardless of fluctuating methane emissions, suggesting
impact educational outcomes, emphasizing the need for that public health programs successfully shield child
comprehensive socioeconomic strategies. In terms of health initiatives from environmental pressures. Future
methane emissions and employment, the data suggests that research may include longitudinal studies to examine the
other economic factors significantly influence employment, long-term impacts of climate change on global health
indicating a need for region-specific solutions. For the trends and economic conditions. For example, conducting
relationship between air pollution and mortality rates, cross-cultural comparisons to assess how different cultures
Volume 3 Issue 2 (2025) 80 https://doi.org/10.36922/ghes.5018