
Page 83 - GHES-3-2
P. 83
Global Health Economics and
Sustainability
Climate change and quality of life
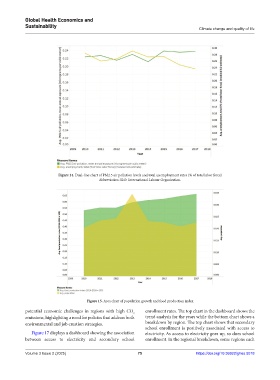
Figure 14. Dual-line chart of PM2.5 air pollution levels and total unemployment rates (% of total labor force)
Abbreviation: ILO: International Labour Organization.
Figure 15. Area chart of population growth and food production index
potential economic challenges in regions with high CO enrollment rates. The top chart in the dashboard shows the
2
emissions, highlighting a need for policies that address both trend analysis for the years while the bottom chart shows a
environmental and job creation strategies. breakdown by region. The top chart shows that secondary
school enrollment is positively associated with access to
Figure 17 displays a dashboard showing the association electricity. As access to electricity goes up, so does school
between access to electricity and secondary school enrollment. In the regional breakdown, some regions such
Volume 3 Issue 2 (2025) 75 https://doi.org/10.36922/ghes.5018