
Page 82 - GHES-3-2
P. 82
Global Health Economics and
Sustainability
Climate change and quality of life
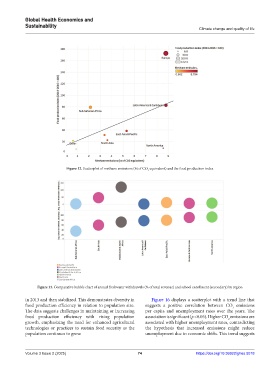
Figure 12. Scatterplot of methane emissions (kt of CO equivalent) and the food production index
2
Figure 13. Comparative bubble chart of annual freshwater withdrawals (% of total revenue) and school enrollment (secondary) by region
in 2013 and then stabilized. This demonstrates diversity in Figure 16 displays a scatterplot with a trend line that
food production efficiency in relation to population size. suggests a positive correlation between CO emissions
2
The data suggests challenges in maintaining or increasing per capita and unemployment rates over the years. The
food production efficiency with rising population association is significant (p <0.05). Higher CO emissions are
2
growth, emphasizing the need for enhanced agricultural associated with higher unemployment rates, contradicting
technologies or practices to sustain food security as the the hypothesis that increased emissions might reduce
population continues to grow. unemployment due to economic shifts. This trend suggests
Volume 3 Issue 2 (2025) 74 https://doi.org/10.36922/ghes.5018