
Page 85 - GHES-3-2
P. 85
Global Health Economics and
Sustainability
Climate change and quality of life
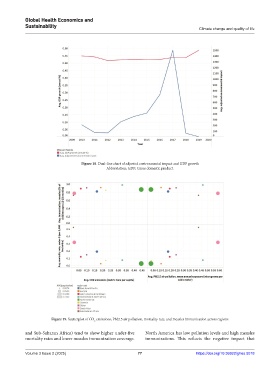
Figure 18. Dual-line chart of adjusted environmental impact and GDP growth
Abbreviation: GDP: Gross domestic product.
Figure 19. Scatterplot of CO emissions, PM2.5 air pollution, mortality rate, and measles immunization across regions
2
and Sub-Saharan Africa) tend to show higher under-five North America has low pollution levels and high measles
mortality rates and lower measles immunization coverage. immunizations. This reflects the negative impact that
Volume 3 Issue 2 (2025) 77 https://doi.org/10.36922/ghes.5018