
Page 87 - GHES-3-2
P. 87
Global Health Economics and
Sustainability
Climate change and quality of life
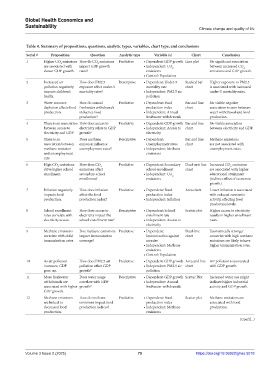
Table 4. Summary of propositions, questions, analytic types, variables, chart type, and conclusions
Serial # Proposition Question Analytic type Variable (s) Chart Conclusion
1 Higher CO emissions How do CO emissions Predictive • Dependent: GDP growth Line plot No significant association
2
2
are associated with impact GDP growth • Independent: CO 2 between increased CO 2
slower GDP growth. rates? emissions emissions and GDP growth.
• Control: Population
2 Increased air How does PM2.5 Descriptive • Dependent: Under‑5 Stacked bar Higher exposure to PM2.5
pollution negatively exposure affect under-5 mortality rate chart is associated with increased
impacts children’s mortality rates? • Independent: PM2.5 air under-5 mortality rates.
health. pollution
3 Water resource How do annual Predictive • Dependent: Food Bar and line No visible negative
depletion affects food freshwater withdrawals production index chart association is seen between
production. influence food • Independent: Annual water withdrawal and food
production? freshwater withdrawals production.
4 There is an association How does access to Predictive • Dependent: GDP growth Bar and line No visible association
between access to electricity relate to GDP • Independent: Access to chart between electricity and GDP.
electricity and GDP growth? electricity
5 There is an Does methane Descriptive • Dependent: Bar and line Methane emissions
association between emission influence Unemployment rates chart are not associated with
methane emission unemployment rates? • Independent: Methane unemployment rates.
and unemployment emissions
rate
6 High CO emissions How does CO 2 Predictive • Dependent: Secondary Dual-axis line Increased CO emissions
2
2
drive higher school emissions affect school enrollment chart are associated with higher
enrollment. secondary school • Independent: CO 2 educational attainment
enrollment? emissions (indirect effect of economic
growth).
7 Inflation negatively How does inflation Predictive • Dependent: Food Area chart Lower inflation is associated
impacts food affect the food production index with reduced economic
production. production index? • Independent: Inflation activity, affecting food
production levels.
8 School enrollment How does access to Descriptive • Dependent: School Scatter plot Higher access to electricity
rates correlate with electricity impact the enrollment rate results in higher enrollment
electricity access. school enrollment rate? • Independent: Access to rates.
electricity
9 Methane emissions Doe methane emissions Predictive • Dependent: Dual-line Economically stronger
correlate with child impact immunization Immunization against chart countries with high methane
immunization rates. coverage? measles emissions are likely to have
• Independent: Methane higher immunization rates.
emissions
• Control: Population
10 As air pollution How does PM2.5 air Predictive • Dependent: GDP growth Area and line Air pollution is associated
increases, GDP pollution affect GDP • Independent: PM2.5 air chart with GDP growth.
goes up. growth? pollution
11 More freshwater Does water usage Descriptive • Dependent: GDP growth Scatter Plot Increased water use might
withdrawals are correlate with GDP • Independent: Annual indicate higher industrial
associated with higher growth? freshwater withdrawals activity and GDP growth.
GDP growth.
12 Methane emissions How do methane Predictive • Dependent: Food Scatter plot Methane emissions are
are linked to emissions impact food production index associated with food
decreased food production indices? • Independent: Methane production.
production. emissions
(Cont’d...)
Volume 3 Issue 2 (2025) 79 https://doi.org/10.36922/ghes.5018