
Page 84 - GHES-3-2
P. 84
Global Health Economics and
Sustainability
Climate change and quality of life
as East Asia & Pacific, Europe, and North America have data suggests that improving access to electricity could
high levels of access to electricity and school enrollment significantly boost educational outcomes, particularly
while others such as Sub-Saharan Africa show lower levels secondary school enrollment, highlighting electricity
of electricity access and school enrollment. Therefore, the access as a key factor in educational development.
Figure 18 displays a dual-line chart graph showing
the adjusted environmental impact and GDP growth
(annual %). The adjusted environmental impact is a
derived measure on the environmental impact per person
(environmental impact score divided by the population).
The chart reveals a dramatic increase in adjusted
environmental impact around 2016 – 2017 to match
a peak in GDP growth, followed by a sharp decline in
both indicators following 2017. This suggests a potential
correlation where periods of economic expansion may
intensify environmental impacts, which is followed by
a rapid decline possibly indicating a tipping point where
environmental costs impact economic performance.
This calls for strategies to balance economic growth with
sustainable environmental practices.
Figure 19 displays the relationships between PM2.5 air
pollution and under-five mortality rates, as well as between
CO emissions and measles immunization coverage, across
2
different regions. The size of each bubble represents the total
Figure 16. Scatterplot of CO emissions (metric tons per capita) and population of the region. Regions with higher pollution
2
unemployment rates (% of total labor force) levels, both PM2.5 and CO emissions (such as South Asia
2
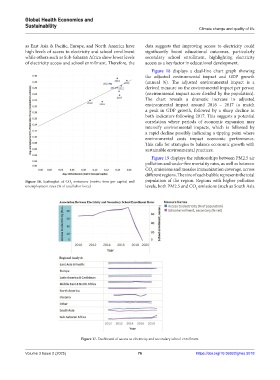
Figure 17. Dashboard of access to electricity and secondary school enrollment
Volume 3 Issue 2 (2025) 76 https://doi.org/10.36922/ghes.5018