
Page 77 - GHES-3-2
P. 77
Global Health Economics and
Sustainability
Climate change and quality of life
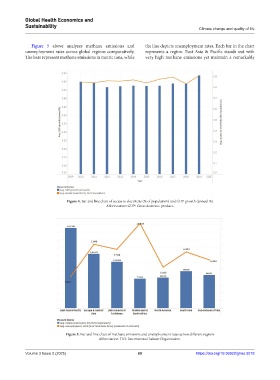
Figure 5 above analyzes methane emissions and the line depicts unemployment rates. Each bar in the chart
unemployment rates across global regions comparatively. represents a region. East Asia & Pacific stands out with
The bars represent methane emissions in metric tons, while very high methane emissions yet maintain a remarkably
Figure 4. Bar and line chart of access to electricity (% of population) and GDP growth (annual %)
Abbreviation: GDP: Gross domestic product.
Figure 5. Bar and line chart of methane emissions and unemployment rates across different regions
Abbreviation: ILO: International Labour Organization.
Volume 3 Issue 2 (2025) 69 https://doi.org/10.36922/ghes.5018