
Page 184 - GHES-3-3
P. 184
Global Health Economics and
Sustainability
Transport and health of pregnant women
cars and commercial buses, respectively. However, chose private cars constitute 11.8%, 9.8%, and 11.2% from
disaggregated results of respondents show that 28.9% of Ibadan Northwest, Ibadan North, and Ibadan Northeast,
the respondents who prefer motorcycles are from Ibadan respectively. However, 19.6%, 24.4%, and 28.9% from
Northwest, 27.5% are from Ibadan North, and 33.9% are Ibadan Northwest, Ibadan North, and Ibadan Northeast,
from Ibadan Northeast. 22.4%, 21.0%, and 26.9% of those respectively, chose commercial cars, while commercial
who chose tricycles are from Ibadan Northwest, Ibadan buses were preferred by 4.5%, 14.0%, and 5.6% of
North, and Ibadan Northeast, respectively. Those who respondents from these areas, respectively. Those who
prefer walking constitute 25.5%, 22.1%, and 30.8% of
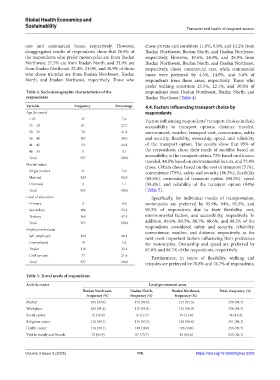
Table 2. Sociodemographic characteristics of the respondents from Ibadan Northwest, Ibadan North, and
respondents Ibadan Northeast (Table 4).
Variable Frequency Percentage 4.4. Factors influencing transport choice by
Age (in years) respondents
< 25 27 7.6
Factors influencing respondents’ transport choices include
25 – 29 81 22.7 accessibility to transport options, distance traveled,
30 – 35 78 21.8 environment, weather, transport cost, convenience, safety
36 – 40 107 30.0 and security, flexibility, ownership, speed, and reliability
41 – 45 53 14.8 of the transport option. The results show that 95% of
46 – 55 11 3.1 the respondents chose their mode of mobility based on
Total 357 100.0 accessibility to the transport option, 72% based on distance
Marital status traveled, 44.8% based on environmental factors, and 73.9%
chose. Others chose based on the cost of transport (51%),
Single mother 21 5.9 convenience (79%), safety and security (86.3%), flexibility
Married 332 93.0 (68.6%), ownership of transport option (60.2%), speed
Divorced 4 1.1 (58.8%), and reliability of the transport option (84%)
Total 357 100.0 (Table 5).
Level of education Specifically, for individual modes of transportation,
Primary 3 0.8 motorcycles are preferred by 95.9%, 94%, 92.5%, and
Secondary 186 52.1 90.3% of respondents due to their flexibility, cost,
Tertiary 168 47.1 environmental factors, and accessibility, respectively. In
Total 357 100.0 addition, 89.6%, 89.3%, 88.7%, 88.6%, and 88.3% of the
Employment status respondents considered safety and security, reliability,
convenience, weather, and distance, respectively, as the
Self-employed 143 40.1 next most important factors influencing their preference
Unemployed 19 5.3 for motorcycles. Ownership and speed are preferred by
Trader 118 33.1 87.0% and 86.7% of the respondents, respectively.
Civil servant 77 21.6
Furthermore, in terms of flexibility, walking and
Total 357 100.0 tricycles are preferred by 78.8% and 76.7% of respondents,
Table 3. Travel needs of respondents
Activity center Local government areas
Ibadan Northwest, Ibadan North, Ibadan Northeast, Total, frequency (%)
frequency (%) frequency (%) frequency (%)
Market 105 (94.6) 112 (94.9) 121 (94.5) 338 (94.7)
Workplace 102 (91.9) 112 (94.9) 124 (96.9) 338 (94.7)
Social center 12 (10.8) 15 (12.7) 19 (14.8) 46 (12.9)
Religious center 110 (99.1) 115 (97.5) 126 (98.4) 351 (98.3)
Health center 110 (99.1) 118 (100) 128 (100) 356 (99.7)
Visit to family and friends 72 (64.9) 87 (73.7) 84 (65.6) 243 (68.1)
Volume 3 Issue 3 (2025) 176 https://doi.org/10.36922/ghes.5203