
Page 185 - GHES-3-3
P. 185
Global Health Economics and
Sustainability
Transport and health of pregnant women
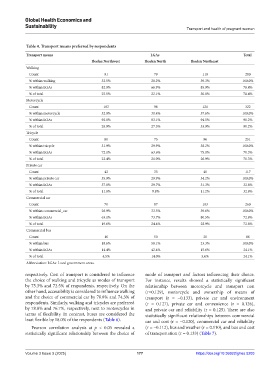
Table 4. Transport means preferred by respondents
Transport means LGAs Total
Ibadan Northwest Ibadan North Ibadan Northeast
Walking
Count 91 79 110 280
% within walking 32.5% 28.2% 39.3% 100.0%
% within LGAs 82.0% 66.9% 85.9% 78.4%
% of total 25.5% 22.1% 30.8% 78.4%
Motorcycle
Count 103 98 121 322
% within motorcycle 32.0% 30.4% 37.6% 100.0%
% within LGAs 92.8% 83.1% 94.5% 90.2%
% of total 28.9% 27.5% 33.9% 90.2%
Tricycle
Count 80 75 96 251
% within tricycle 31.9% 29.9% 38.2% 100.0%
% within LGAs 72.1% 63.6% 75.0% 70.3%
% of total 22.4% 21.0% 26.9% 70.3%
Private car
Count 42 35 40 117
% within private car 35.9% 29.9% 34.2% 100.0%
% within LGAs 37.8% 29.7% 31.3% 32.8%
% of total 11.8% 9.8% 11.2% 32.8%
Commercial car
Count 70 87 103 260
% within commercial_car 26.9% 33.5% 39.6% 100.0%
% within LGAs 63.1% 73.7% 80.5% 72.8%
% of total 19.6% 24.4% 28.9% 72.8%
Commercial bus
Count 16 50 20 86
% within bus 18.6% 58.1% 23.3% 100.0%
% within LGAs 14.4% 42.4% 15.6% 24.1%
% of total 4.5% 14.0% 5.6% 24.1%
Abbreviation: LGAs: Local government areas.
respectively. Cost of transport is considered to influence mode of transport and factors influencing their choice.
the choice of walking and tricycle as modes of transport For instance, results showed a statistically significant
by 75.3% and 72.5% of respondents, respectively. On the relationship between motorcycle and transport cost
other hand, accessibility is considered to influence walking (r=0.129), motorcycle and ownership of means of
and the choice of commercial car by 78.8% and 74.3% of transport (r = −0.133), private car and environment
respondents. Similarly, walking and tricycles are preferred (r = 0.127), private car and convenience (r = 0.126),
by 78.8% and 76.7%, respectively, next to motorcycles in and private car and reliability (r = 0.125). There are also
terms of flexibility. In contrast, buses are considered the statistically significant relationships between commercial
least flexible by 18.0% of the respondents (Table 6). car and cost (r = −0.120), commercial car and reliability
Pearson correlation analysis at p < 0.05 revealed a (r = −0.112), bus and weather (r = 0.110), and bus and cost
statistically significant relationship between the choice of of transportation (r = 0.133) (Table 7).
Volume 3 Issue 3 (2025) 177 https://doi.org/10.36922/ghes.5203