
Page 186 - GHES-3-3
P. 186
Global Health Economics and
Sustainability
Transport and health of pregnant women
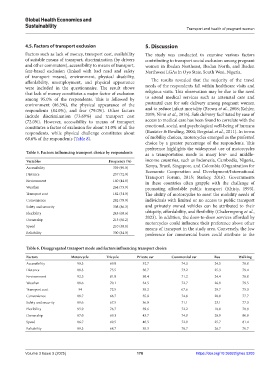
4.5. Factors of transport exclusion 5. Discussion
Factors such as lack of money, transport cost, availability The study was conducted to examine various factors
of suitable means of transport, discrimination (by drivers contributing to transport social exclusion among pregnant
and other commuters), accessibility to means of transport, women in Ibadan Northeast, Ibadan North, and Ibadan
fear-based exclusion (linked with bad road and safety Northwest LGAs in Oyo State, South West, Nigeria.
of transport means), environment, physical disability,
affordability, unemployment, and physical appearance The results revealed that the majority of the travel
were included in the questionnaire. The result shows needs of the respondents fall within healthcare visits and
that lack of money constitutes a major factor of exclusion religious visits. This observation may be due to the need
among 95.0% of the respondents. This is followed by to attend medical services such as antenatal care and
environment (86.3%), the physical appearance of the postnatal care for safe delivery among pregnant women
respondents (84.0%), and fear (79.0%). Other factors and to reduce infant mortality (Brown et al., 2008; Kohler,
include discrimination (73.69%) and transport cost 2019; Nimi et al., 2016). Safe delivery facilitated by ease of
(72.0%). However, accessibility to means of transport access to medical care has been found to correlate with the
constitutes a factor of exclusion for about 51.0% of all the emotional, social, and psychological well-being of humans
respondents, while physical challenge constitutes about (Banister & Bowling, 2004; Bergstad et al., 2011). In terms
68.6% of the respondents (Table 8). of mobility choices, motorcycles emerged as the preferred
choice by a greater percentage of the respondents. This
preference highlights the widespread use of motorcycles
Table 5. Factors influencing transport choice by respondents as a transportation mode in many low- and middle-
Variables Frequency (%) income countries, such as Indonesia, Cambodia, Nigeria,
Accessibility 339 (95.0) Kenya, Brazil, Singapore, and Colombia (Organization for
Distance 257 (72.0) Economic Cooperation and Development/International
Transport Forum, 2015; Starkey, 2016). Governments
Environment 160 (44.8) in these countries often grapple with the challenge of
Weather 264 (73.9) promoting affordable public transport (Khisty, 1993).
Transport cost 182 (51.0) The ability of motorcycles to meet the mobility needs of
Convenience 282 (79.0) individuals with limited or no access to public transport
Safety and security 308 (86.3) and privately owned vehicles can be attributed to their
Flexibility 245 (68.6) ubiquity, affordability, and flexibility (Chalermpong et al.,
Ownership 215 (60.2) 2023). In addition, the door-to-door services afforded by
motorcycles could influence their preference above other
Speed 210 (58.8) means of transport in the study area. Conversely, the low
Reliability 300 (84.0) preference for commercial buses could attribute to the
Table 6. Disaggregated transport mode and factors influencing transport choice
Factors Motorcycle Tricycle Private car Commercial car Bus Walking
Accessibility 90.3 69.9 32.7 74.3 24.5 78.8
Distance 88.3 75.5 30.7 73.2 25.3 79.4
Environment 92.5 81.9 39.4 71.2 24.4 78.8
Weather 88.6 70.1 34.5 72.7 26.9 79.5
Transport cost 94 72.5 35.2 67.6 29.7 75.3
Convenience 88.7 66.7 35.8 74.8 28.0 77.7
Safety and security 89.6 67.5 36.0 71.1 23.1 77.3
Flexibility 95.9 76.7 39.6 72.2 18.0 78.8
Ownership 87.0 69.3 43.7 74.9 20.9 80.9
Speed 86.7 69.5 40.5 72.9 25.7 81.4
Reliability 89.3 68.7 35.3 70.7 26.7 76.7
Volume 3 Issue 3 (2025) 178 https://doi.org/10.36922/ghes.5203