
Page 187 - GHES-3-3
P. 187
Global Health Economics and
Sustainability
Transport and health of pregnant women
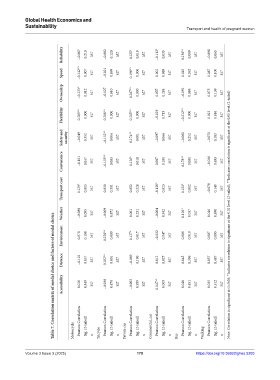
Reliability −0.067 0.210 357 −0.082 0.120 357 0.125* 0.018 357 −0.112* 0.035 357 0.138** 0.009 357 −0.098 0.063 357
Speed −0.142** 0.007 357 −0.021 0.699 357 0.196** 0.000 357 0.001 0.989 357 0.045 0.392 357 0.087 0.100 357
Ownership −0.133* 0.012 357 −0.027 0.610 357 0.287** 0.000 357 0.057 0.284 357 −0.091 0.086 357 0.075 0.159 357
Flexibility 0.285** 0.000 357 0.208** 0.000 357 0.215** 0.000 357 −0.019 0.715 357 −0.212** 0.000 357 0.012 0.816 357
Safety and security −0.049 0.352 357 −0.152** 0.004 357 0.174** 0.001 357 −0.097 0.066 357 −0.061 0.252 357 −0.071 0.183 357
Convenience −0.101 0.057 357 −0.155** 0.003 357 0.126* 0.018 357 0.087 0.101 357 0.178** 0.001 357 −0.036 0.493 357
Transport cost 0.129* 0.015 357 0.050 0.351 357 0.052 0.328 357 −0.120* 0.023 357 0.133* 0.012 357 −0.078 0.140 357
Weather −0.088 0.095 357 −0.009 0.872 357 0.061 0.251 357 −0.004 0.942 357 0.110* 0.037 357 0.046 0.390 357 Note: Correlation is significant at α=0.05; *Indicates correlation is significant at the 0.01 level (2-tailed); **Indicates correlation is significant at the 0.05 level (2-tailed)
Table 7. Correlation matrix of modal choice and factors of modal choice
Environment 0.070 0.188 357 0.228** 0.000 357 0.127* 0.017 357 −0.032 0.547 357 0.006 0.910 357 0.007 0.895 357
Distance −0.101 0.057 357 0.182** 0.001 357 −0.069 0.190 357 0.012 0.827 357 0.045 0.396 357 0.037 0.487 357
Accessibility 0.010 0.849 357 −0.038 0.478 357 −0.003 0.959 357 0.147** 0.005 357 0.040 0.451 357 0.035 0.512 357
Pearson Correlation Pearson Correlation Pearson Correlation Pearson Correlation Pearson Correlation Pearson Correlation
Motorcycle Sig. (2-tailed) n Tricycle Sig. (2-tailed) n Private car Sig. (2-tailed) n Commercial_car Sig. (2-tailed) n Bus Sig. (2-tailed) n Walking Sig. (2-tailed) n
Volume 3 Issue 3 (2025) 179 https://doi.org/10.36922/ghes.5203