
Page 262 - GHES-3-3
P. 262
Global Health Economics and
Sustainability
Sustainability of Rwanda’s UHC: 2011–2021 and vision 2050
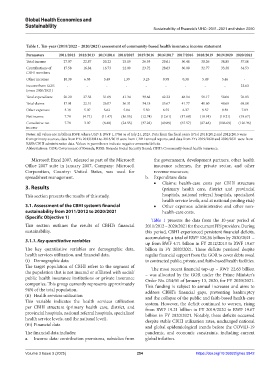
Table 1. Ten‑year (2011/2022 – 2020/2021) assessment of community‑based health insurance income statement
Parameters 2011/2012 2012/2013 2013/2014 2014/2015 2015/2016 2016/2017 2017/2018 2018/2019 2019/2020 2020/2021
Total income 27.97 22.87 20.22 25.19 26.95 29.61 30.46 38.26 38.85 57.16
Contributions of 17.58 16.84 16.73 22.09 23.72 28.63 30.08 32.77 33.38 34.53
CBHI members
Other incomes 10.39 6.03 3.49 1.39 3.23 0.98 0.38 5.49 5.46 -
Income from GOR - - - - - - - - - 22.63
(since 2020/2021)
Total expenditure 20.20 27.58 31.69 41.34 39.68 42.22 48.14 58.17 58.06 76.83
Total claims 17.01 22.51 26.07 36.31 34.18 35.67 41.77 48.60 48.68 69.00
Other expenses 3.19 5.07 5.62 5.04 5.50 6.55 6.37 9.57 9.38 7.83
Net income 7.78 (4.71) (11.47) (16.15) (12.74) (12.61) (17.68) (19.91) (19.21) (19.67)
Cumulative net 7.78 3.07 (8.40) (24.55) (37.28) (49.89) (67.57) (87.48) (106.69) (126.36)
income
Notes: All values are in billion RWF, where USD 1: RWF 1,170.6 as of July 21, 2023. Data from the fiscal years (FYs) 2011/2012 and 2012/2013 were
from primary sources, data from FYs 2013/2014 to 2018/2019 were from CBHI annual reports, and data from FYs 2019/2020 and 2020/2021 were from
RSSB/CBHI administrative data. Values in parentheses indicate negative amounts/deficits.
Abbreviations: GOR: Government of Rwanda; RSSB: Rwanda Social Security Board; CBHI: Community-based health insurance.
Microsoft Excel 2007, released as part of the Microsoft the government, development partners, other health
Office 2007 suite in January 2007, Company: Microsoft insurance schemes, the private sector, and other
Corporation, Country: United States, was used for revenue resources;
spreadsheet management. b. Expenditure data:
• Claims: health-care costs per CBHI structure
3. Results (primary health care, district and provincial
This section presents the results of this study. hospitals, national referral hospitals, specialized
health service levels, and at national pooling risk)
3.1. Assessment of the CBHI system’s financial • Other expenses: administrative and other non-
sustainability from 2011/2012 to 2020/2021 health-care costs.
(Specific Objective 1)
Table 1 presents the data from the 10-year period of
This section outlines the results of CBHI’s financial 2011/2012 – 2020/2021 for the current FFS providers. During
sustainability. this period, CBHI experienced persistent financial deficits,
accumulating a total of RWF 126.36 billion by 2020/2021 –
3.1.1. Key quantitative variables
up from RWF 4.71 billion in FY 2012/2013 to RWF 19.67
The key quantitative variables are demographic data, billion in FY 2020/2021. These deficits persisted despite
health services utilization, and financial data. regular financial support from the GOR to cover debts owed
(i) Demographic data to contracted public, private, and faith-based health facilities.
The target population of CBHI refers to the segment of The most recent financial top-up – RWF 22.63 billion
the population that is not insured or affiliated with social/ – was allocated by the GOR under the Prime Minister’s
public health insurance institutions or private insurance Order No. 034/01 of January 13, 2020, for FY 2020/2021.
companies. This group currently represents approximately This funding is subject to annual increases and aims to
94% of the total population. address CBHI’s financial gaps, preventing bankruptcy
(ii) Health services utilization and the collapse of the public and faith-based health-care
This variable indicates the health services utilization system. However, the deficit continued to worsen, rising
per CBHI structure (primary health care, district, and from RWF 19.21 billion in FY 2019/2020 to RWF 19.67
provincial hospitals, national referral hospitals, specialized billion in FY 2020/2021. Notably, these deficits occurred
health service levels, and the national level). despite stable CBHI utilization rates, unchanged national
(iii) Financial data and global epidemiological trends before the COVID-19
The financial data includes: pandemic, and economic constraints, including current
a. Income data: contribution premiums, subsidies from global inflation.
Volume 3 Issue 3 (2025) 254 https://doi.org/10.36922/ghes.5842