
Page 13 - GPD-1-1
P. 13
Gene & Protein in Disease Bioinformatics study of PCNP
were calculated using MDS for the 50-ns time interval. The a buffer system for purification by the pI method . The
[42]
results of RMSD and RMSF are presented in Figure 2. The instability index of PCNP protein was computed as 15.56,
RMSD values were observed in the range of 0.2–0.9 nm which indicates that the protein may be marginally stable
of the protein model. In brief, the results revealed that the as the values are lower than 40. The instability index of a
RMSD value came to equilibrium, maintaining around protein greater than 40 indicates that the protein is likely
0.6–0.8 nm throughout the MDS run of 50 ns (Figure 2A). to be unstable.
Although the lack of experimental structure, these MDS In addition, the value of the aliphatic index, which is
results suggest that the protein model is dynamically stable the relative volume of aliphatic side chains, indicates the
throughout the MDS period with a slightly higher RMSD thermal stability of a protein structure. The higher the
value. Similarly, the amino acid residue wise fluctuation, positive factor value, the greater the thermal stability of
the RMSF value, was plotted and is shown in Figure 2B. the respective protein. The aliphatic index of PCNP was
The RMSF analysis demonstrated that notable deviations calculated to be 89.93, indicating its stability at higher
have occurred in the first 20–25 amino acid residues, but temperatures . The grand average of the hydropathicity
[43]
this type of high fluctuation was not observed in other of the protein was predicted to be −0.463, which indicates
residues throughout the MDS period.
the hydrophilic nature of the protein and improved
3.3. Physicochemical characterization and interaction with water. The detailed results are documented
secondary structure prediction in Figure S1.
The ProtParam tool, available on the ExPASy server, Of the total 178 amino acids, 58 (32.58%) were found
predicts the physiochemical properties of the protein in the alpha helix, 11 (6.18%) in the extended strand,
under investigation. The PCNP gene encodes a protein of 8 (4.49%) in the beta turns, and 101 (56.74%) in the
178 amino acids (C H 1304 N O S ) having a molecular random coil region of the PCNP protein as predicted by
805
280 4
238
weight of 18924.88 kDa. The theoretical isoelectric point the SOPMA tool. These results demonstrate that the PCNP
(pI) of this protein was found to be 6.86 with 28 negatively protein secondary structure has a dominant random coil
charged residues (Asp + Glu) and 28 positively charged region followed by beta turns and an alpha helix. The
residues (Arg + Lys). At this computed pI, the PCNP protein detailed results are presented in Figure S2.
seemed to be stable and compact and was considered
slightly acidic. These results will be helpful in preparing 3.4. GO and pathway enrichment analysis
GO is an efficient machine learning method useful for the
A B identification of biological processes, molecular functions,
and cellular components of a query protein. In the present
study, a total of 46 biological processes, 10 molecular
functions, and 10 cellular components of PCNP were
identified by the Network Analyst server (Table S1). All
C D the predicted biological processes results were below 0.05
(P-value) and considered a significant outcome. The top 10
biological processes results are demonstrated in Figure 3A.
In biological processes analysis, our results indicate
that PCNP has proximate and profound involvement in
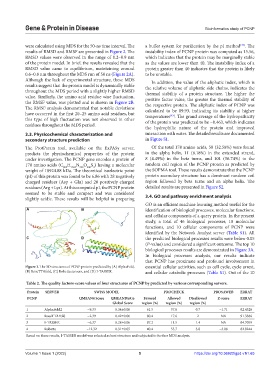
Figure 1. The 3D structures of PCNP protein predicted by (A) AlphaFold, essential cellular activities, such as cell cycle, cycle arrest,
(B) RoseTTAfold, (C) Robetta servers, and (D) I-TASSER. and cellular catabolic processes (Table S1). Out of the 10
Table 2. The quality factors‑score values of four structures of PCNP by predicted by various corresponding servers.
Protein SERVER SWISS MODEL PROCHECK PROSAWEB ERRAT
PCNP QMEAN4 Score QMEANDisCo Favored Allowed Disallowed Z‑score ERRAT
Global Score region (%) region (%) region (%)
1 AlphaFold2 −9.33 0.34±0.06 61.5 37.8 0.7 −1.71 92.4528
2 RoseTTAFold −2.39 0.42±0.06 80.4 17.6 2 NA 91.3386
3 I-TASSER −6.37 0.28±0.06 87.2 11.5 1.4 NA 94.7059
4 Robetta −12.32 0.31±0.05 40.4 55.7 3.8 −3.08 82.8244
Based on these results, I-TASSER model was selected as best structure and subjected to further MDS analysis.
Volume 1 Issue 1 (2022) 5 https://doi.org/10.36922/gpd.v1i1.65