
Page 14 - GPD-1-1
P. 14
Gene & Protein in Disease Bioinformatics study of PCNP
A B
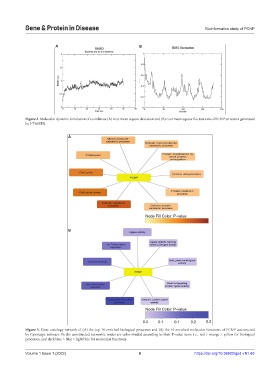
Figure 2. Molecular dynamic simulation of coordinate (A) root mean square deviation and (B) root mean square fluctuations of PCNP structure generated
by I-TASSER.
A
B
Figure 3. Gene ontology network of (A) the top 10 enriched biological processes and (B) the 10 enriched molecular functions of PCNP constructed
by Cytoscape software. In the constructed networks, nodes are color-shaded according to their P-value score i.e., red > orange > yellow for biological
processes, and dark blue > blue > light blue for molecular functions.
Volume 1 Issue 1 (2022) 6 https://doi.org/10.36922/gpd.v1i1.65