
Page 16 - GPD-1-1
P. 16
Gene & Protein in Disease Bioinformatics study of PCNP
A
B
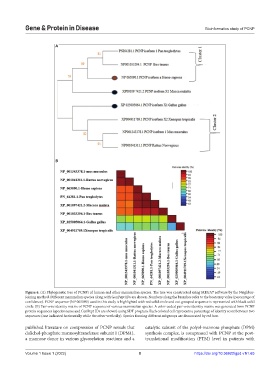
Figure 6. (A) Phylogenetic tree of PCNP) of human and other mammalian species. The tree was constructed using MEGA7 software by the Neighbor-
Joining method. Different mammalian species along with GenPept IDs are shown. Numbers along the branches refer to the bootstrap value (percentage of
confidence). PCNP sequence (NP 065090) used in this study is highlighted with red solid circle and out-grouped sequence is represented with black solid
circle. (B) Pair-wise identity matrix of PCNP sequence of various mammalian species. A color-coded pair-wise identity matrix was generated from PCNP
protein sequences (species name and GenPept IDs are shown) using SDT program. Each colored cell represents a percentage of identity score between two
sequences (one indicated horizontally while the other vertically). Species forming different subgroups are demarcated by red box.
published literature on coexpression of PCNP reveals that catalytic subunit of the polyol-mannose phosphate (DPM)
dolichol-phosphate mannosyltransferase subunit 1 (DPM1), synthesis complex, is coexpressed with PCNP at the post-
a mannose donor in various glycosylation reactions and a translational modification (PTM) level in patients with
Volume 1 Issue 1 (2022) 8 https://doi.org/10.36922/gpd.v1i1.65