
Page 57 - GPD-2-2
P. 57
Gene & Protein in Disease Transfection methods for TK6 cells
in a humidified 37°C/5% CO atmosphere. Transfection 3. Results
2
efficiency using GFP was determined by fluorescence
microscopy and by assaying for normalized luciferase 3.1. Optimizing transfection conditions for
activity. Cell viability was determined using the Vi-CELL Metafectene Pro transfection reagent
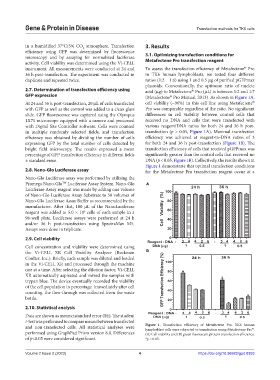
instrument. All measurements were conducted at 24 and To assess the transfection efficiency of Metafectene Pro
®
36 h post-transfection. The experiment was conducted in in TK6 human lymphoblasts, we tested four different
duplicate and repeated twice. ratios (1:2 – 1:6) using 1 and 0.5 µg of purified pGFPmax
plasmids. Conventionally, the optimum ratio of nucleic
2.7. Determination of transfection efficiency using acid (µg) to Metafectene Pro (µL) is between 1:2 and 1:7
®
GFP expression (Metafectene Pro Manual, 2013). As shown in Figure 1A,
®
At 24 and 36 h post-transfection, 20 µL of cells transfected cell viability (~96%) in this cell line using Metafectene
®
with GFP as well as the control was added to a clean glass Pro was comparable regardless of the ratio. No significant
slide. GFP fluorescence was captured using the Olympus differences in cell viability between control cells that
1X71 microscope equipped with a camera and processed received no DNA and cells that were transfected with
with Digital Site Controller software. Cells were counted various reagent/DNA ratios for both 24 and 36 h post-
in multiple randomly selected fields, and transfection transfection (p > 0.05, Figure 1A). Maximal transfection
efficiency was obtained by dividing the number of cells efficiency was achieved at reagent-to-DNA ratios of 3
expressing GFP by the total number of cells detected by for both 24 and 36 h post-transfection (Figure 1B). The
bright field microscopy. The results expressed a mean transfection efficiency of cells that received pGFPmax was
percentage of GFP transfection efficiency in different fields significantly greater than the control cells that received no
± standard error. DNA (p < 0.05, Figure 1B). Collectively, the results shown in
Figure 1 demonstrate that optimal transfection conditions
2.8. Nano-Glo Luciferase assay for the Metafectene Pro transfection reagent occur at a
Nano-Glo Luciferase assay was performed by utilizing the
Promega Nano-Glo Luciferase Assay System. Nano-Glo A
TM
Luciferase Assay reagent was made by adding one volume
of Nano-Glo Luciferase Assay Substrate to 50 volumes of
Nano-Glo Luciferase Assay Buffer as recommended by the
manufacturer. After that, 100 µL of the NanoLuciferase
reagent was added to 5.0 × 10 cells of each sample in a
5
96-well plate. Luciferase assays were performed at 24 h
and/or 36 h post-transfection using SpectraMax M5.
Assays were done in triplicate.
2.9. Cell viability
Cell concentration and viability were determined using
the Vi-CELL XR Cell Viability Analyzer (Beckman B
Coulter, Inc.). Briefly, each sample was diluted and loaded
in the Vi-CELL XR and processed through the machine
one at a time. After selecting the dilution factor, Vi-CELL
XR automatically aspirated and mixed the samples with
trypan blue. The device eventually recorded the viability
of the cell population in percentage. Immediately after cell
counting, the flow-through was collected from the waste
bottle.
2.10. Statistical analysis
Data are shown as means±standard error (SE). The student
t-test was performed to compare means between transfected
and non-transfected cells. All statistical analyses were Figure 1. Transfection efficiency of Metafectene Pro. TK6 human
®
lymphoblast cells were subjected to transfection using Metafectene Pro .
performed using GraphPad Prism version 8.0. Differences (A) Cell viability and (B) green fluorescent protein transfection efficiency.
of p<0.05 were considered significant. *p < 0.05.
Volume 2 Issue 2 (2023) 4 https://doi.org/10.36922/gpd.0353