
Page 140 - GPD-3-2
P. 140
Gene & Protein in Disease Placenta, FASD, and soy
A B
C
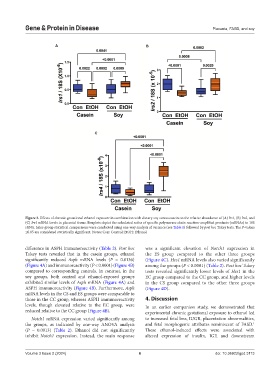
Figure 3. Effects of chronic gestational ethanol exposure in combination with dietary soy versus casein on the relative abundance of (A) Irs1, (B) Irs2, and
(C) Irs4 mRNA levels in placental tissue. Boxplots depict the calculated ratios of specific polymerase chain reaction-amplified products (mRNAs) to 18S
rRNA. Inter-group statistical comparisons were conducted using one-way analysis of variance (see Table 1) followed by post hoc Tukey tests. The P-values
≤0.05 are considered statistically significant. Notes: Con: Control; EtOH: Ethanol.
difference in ASPH immunoreactivity (Table 2). Post hoc was a significant elevation of Notch1 expression in
Tukey tests revealed that in the casein groups, ethanol the ES group compared to the other three groups
significantly reduced Asph mRNA levels (P = 0.0136) (Figure 4C). Hes1 mRNA levels also varied significantly
(Figure 4A) and immunoreactivity (P < 0.0001) (Figure 4B) among the groups (P < 0.0001) (Table 2). Post hoc Tukey
compared to corresponding controls. In contrast, in the tests revealed significantly lower levels of Hes1 in the
soy groups, both control and ethanol-exposed groups EC group compared to the CC group, and higher levels
exhibited similar levels of Asph mRNA (Figure 4A) and in the CS group compared to the other three groups
ASPH immunoreactivity (Figure 4B). Furthermore, Asph (Figure 4D).
mRNA levels in the CS and ES groups were comparable to
those in the CC group, whereas ASPH immunoreactivity 4. Discussion
levels, though elevated relative to the EC group, were In an earlier companion study, we demonstrated that
reduced relative to the CC group (Figure 4B). experimental chronic gestational exposure to ethanol led
Notch1 mRNA expression varied significantly among to increased fetal loss, IUGR, placentation abnormalities,
the groups, as indicated by one-way ANOVA analysis and fetal morphogenic attributes reminiscent of FASD.
1
(P = 0.0013) (Table 2). Ethanol did not significantly These ethanol-induced effects were associated with
inhibit Notch1 expression. Instead, the main response altered expression of insulin, IGF, and downstream
Volume 3 Issue 2 (2024) 6 doi: 10.36922/gpd.3113