
Page 139 - GPD-3-2
P. 139
Gene & Protein in Disease Placenta, FASD, and soy
A B
C
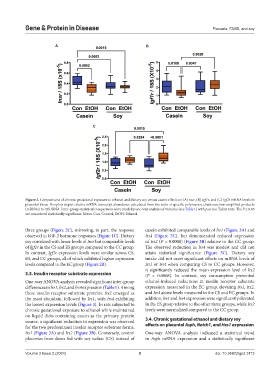
Figure 2. Comparisons of chronic gestational exposure to ethanol and dietary soy versus casein effects on (A) Insr, (B) Igf1r, and (C) Igf2r mRNA levels in
placental tissue. Boxplots depict relative mRNA transcript abundance calculated from the ratio of specific polymerase chain reaction-amplified products
(mRNAs) to 18S rRNA. Inter-group statistical comparisons were made by one-way analysis of variance (see Table 1) with post hoc Tukey tests. The P ≤ 0.05
are considered statistically significant. Notes: Con: Control; EtOH: Ethanol.
three groups (Figure 2C), mirroring, in part, the response casein exhibited comparable levels of Irs1 (Figure 3A) and
observed in IGF-2 hormone responses (Figure 1C). Dietary Irs4 (Figure 3C), but demonstrated reduced expression
soy correlated with lower levels of Insr but comparable levels of Irs2 (P = 0.0008) (Figure 3B) relative to the CC group.
of Igf1r in the CS and ES groups compared to the CC group. The observed reduction in Irs4 was modest and did not
In contrast, Igf1r expression levels were similar across CS, attain statistical significance (Figure 3C). Dietary soy
ES, and CC groups, all of which exhibited higher expression intake did not exert significant effects on mRNA levels of
levels compared to the EC group (Figure 2B). Irs1 or Irs4 when comparing CS to CC groups. However,
it significantly reduced the mean expression level of Irs2
3.3. Insulin receptor substrate expression (P = 0.0008). In contrast, soy consumption prevented
One-way ANOVA analysis revealed significant inter-group ethanol-induced reductions in insulin receptor substrate
differences in Irs1, Irs2, and Irs4 expression (Table 1). Among expression measured in the EC group, elevating Irs1, Irs2,
these insulin receptor substrate proteins, Irs2 emerged as and Irs4 above levels measured in the CS and EC groups. In
the most abundant, followed by Irs1, with Irs4 exhibiting addition, Irs1 and Irs4 expression were significantly elevated
the lowest expression levels (Figure 3). In rats subjected to in the ES group relative to the other three groups, while Irs2
chronic gestational exposure to ethanol while maintained levels were normalized compared to the CC group.
on liquid diets containing casein as the primary protein
source, a significant reduction in expression was observed 3.4. Chronic gestational ethanol and dietary soy
for the two predominant insulin receptor substrate forms, effects on placental Asph, Notch1, and Hes1 expression
Irs1 (Figure 3A) and Irs2 (Figure 3B). Conversely, control One-way ANOVA analysis indicated a statistical trend
placentas from dams fed with soy isolate (CS) instead of in Asph mRNA expression and a statistically significant
Volume 3 Issue 2 (2024) 5 doi: 10.36922/gpd.3113