
Page 137 - GPD-3-2
P. 137
Gene & Protein in Disease Placenta, FASD, and soy
earlier exposures cause excessive fetal loss and impair 3. Results
placentation. 24,25 The dams’ food intake, behavior, and body
weights were monitored daily, as previously reported. 1 While it is established that soy offers antioxidant and
insulin-sensitizing benefits, the mechanisms implicated in
2.3. Quantitative reverse transcriptase-PCR analysis normalizing placentation and fetal development vis-à-vis
continued chronic high-level ethanol exposures have
Quantitative reverse transcriptase-PCR (qRT-PCR)
analysis was employed to measure insulin (Ins), Igf1, not been thoroughly evaluated. Herein, we investigated
the potential effects of ethanol and dietary soy on
Igf2, insulin receptor (Insr), Igf1r, Igf2r, insulin receptor
substrate type 1 (Irs1), Irs2, Irs4, Asph, Notch1, and Hes1 insulin/IGF pathway gene expression, as previous studies
mRNA transcripts using gene-specific primer pairs indicated that chronic ethanol exposures can significantly
through the methodology previously described. The modulate the expression of mRNA transcripts encoding
7
7
PCR primers were designed using MacVector 10 software proteins critical to signal transduction. Moreover, if the
(MacVector, Inc., USA), and their target specificities were previously reported experimental responses to ethanol
confirmed through the NCBI-BLAST (National Center and dietary soy in placentas and fetuses were mediated
for Biotechnology Information-Basic Local Alignment by chronic alterations in gene expression, it would be
Search Tool). Results were analyzed using the Mastercycler necessary to ascertain measures that could ensure future
ep realplex instrument and software (Eppendorf AG, therapeutic interventions favorably impact long-term
Germany). The relative abundance of each mRNA transcript pathophysiological processes responsible for sustained
was expressed as the calculated ratio of specific mRNA to impairments in intracellular signaling. To achieve this, we
18S rRNA. All assays were performed in triplicate. measured mRNA levels corresponding to the insulin and
IGF polypeptides and receptors, including Ins, Igf1, Igf2,
2.4. ELISAs Insr, Igf1r, Igf2r, Irs1, Irs2, Irs4, Asph, Notch1, and Hes1.
Placental tissue homogenates, prepared in 3.1. Insulin and insulin growth factor mRNA
radioimmunoprecipitation assay (RIPA) buffer containing expression
protease and phosphatase inhibitors, 26,27 were used to
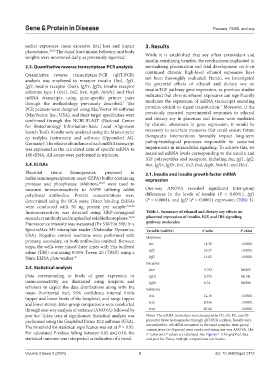
measure immunoreactivity to ASPH utilizing rabbit One-way ANOVA revealed significant inter-group
polyclonal antibodies. Protein concentrations were differences in the levels of insulin (P < 0.0001), Igf1
determined using the BCA assay. Direct binding ELISAs (P < 0.0001), and Igf2 (P < 0.0001) expression (Table 1).
were conducted with 50 ng protein per sample. 9,21,28
Immunoreactivity was detected using HRP-conjugated Table 1. Summary of ethanol and dietary soy effects on
secondary antibody and Amplex Red soluble fluorophore. 26,28 placental expression of insulin, IGF, and IRS signaling
Fluorescence intensity was measured (Ex 530/Em 590) in a pathway molecules
SpectraMax M5 microplate reader (Molecular Dynamics, Variable (mRNA) F‑ratio P‑value
USA). Negative control reactions were performed with Hormone
primary, secondary, or both antibodies omitted. Between
steps; the wells were rinsed three times with Tris-buffered Ins 11.36 <0.0001
saline (TBS) containing 0.05% Tween 20 (TBST) using a Igf1 10.27 <0.0001
Nunc ELISA plate washer. 28 Igf2 13.02 <0.0001
Receptor
2.5. Statistical analysis Insr 5.763 0.0015
Data corresponding to levels of gene expression or Igf1r 3.775 0.0141
immunoreactivity are illustrated using boxplots and Igf2r 6.74 0.0006
whiskers to depict the data distributions along with the Substrate
mean (horizontal bar), 95% confidence interval limits Irs1 12.16 <0.0001
(upper and lower limits of the boxplots), and range (upper
and lower stems). Inter-group comparisons were conducted Irs2 9.356 <0.0001
through one-way analysis of variance (ANOVA) followed by Irs4 47.62 <0.0001
post hoc Tukey tests of significance. Statistical analysis was Notes: The mRNA transcripts were measured in CC, CS, EC, and ES
performed using the GraphPad Prism 10.2 software (USA). placental tissue homogenates through qRT-PCR analysis. Results were
The threshold for statistical significance was set at P ≤ 0.05. normalized to 18S rRNA measured in the same samples. Inter-group
comparisons (n=8/group) were conducted using one-way ANOVA. The
For calculated P-values falling between 0.05 and 0.10, the F-ratios and P-values are tabulated. See Figures 1-3 for graphed data
statistical outcome was interpreted as indicative of a trend. and post hoc Tukey multiple comparisons test results.
Volume 3 Issue 2 (2024) 3 doi: 10.36922/gpd.3113