
Page 138 - GPD-3-2
P. 138
Gene & Protein in Disease Placenta, FASD, and soy
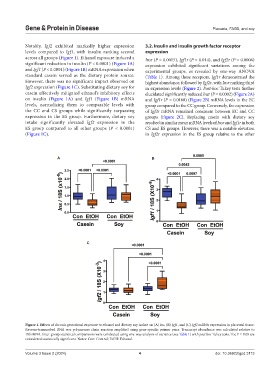
Notably, Igf2 exhibited markedly higher expression 3.2. Insulin and insulin growth factor receptor
levels compared to Igf1, with insulin ranking second expression
across all groups (Figure 1). Ethanol exposure induced a Insr (P = 0.0015), Igf1r (P = 0.014), and Igf2r (P = 0.0006)
significant reduction in insulin (P < 0.0001) (Figure 1A) expression exhibited significant variations among the
and Igf1 (P < 0.0001) (Figure 1B) mRNA expression when experimental groups, as revealed by one-way ANOVA
standard casein served as the dietary protein source. (Table 1). Among these receptors, Igf1r demonstrated the
However, there was no significant impact observed on highest abundance, followed by Igf2r, with Insr ranking third
Igf2 expression (Figure 1C). Substituting dietary soy for in expression levels (Figure 2). Post-hoc Tukey tests further
casein effectively mitigated ethanol’s inhibitory effects elucidated significantly reduced Insr (P = 0.0002) (Figure 2A)
on insulin (Figure 1A) and Igf1 (Figure 1B) mRNA and Igf1r (P = 0.0168) (Figure 2B) mRNA levels in the EC
levels, normalizing them to comparable levels with group compared to the CC group. Conversely, the expression
the CC and CS groups while significantly surpassing of Igf2r mRNA remained consistent between EC and CC
expression in the ES group. Furthermore, dietary soy groups (Figure 2C). Replacing casein with dietary soy
intake significantly elevated Igf2 expression in the resulted in similar mean mRNA levels of Insr and Igf1r in both
ES group compared to all other groups (P < 0.0001) CS and ES groups. However, there was a notable elevation
(Figure 1C). in Igf2r expression in the ES group relative to the other
A B
C
Figure 1. Effects of chronic gestational exposure to ethanol and dietary soy isolate on (A) Ins, (B) Igf1, and (C) Igf2 mRNA expression in placental tissue.
Reverse-transcribed RNA was polymerase chain reaction amplified using gene-specific primer pairs. Transcript abundance was calculated relative to
18S rRNA. Inter-group statistical comparisons were conducted using one-way analysis of variance (see Table 1) with post hoc Tukey tests. The P ≤ 0.05 are
considered statistically significant. Notes: Con: Control; EtOH: Ethanol.
Volume 3 Issue 2 (2024) 4 doi: 10.36922/gpd.3113