
Page 105 - GPD-3-3
P. 105
Gene & Protein in Disease Exploring serum inflammatory biomarkers in GBM
A B
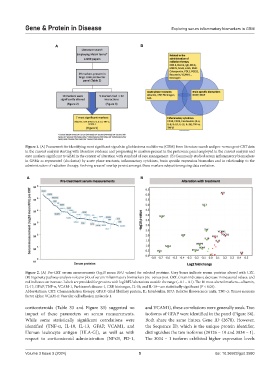
Figure 1. (A) Framework for identifying most significant signals in glioblastoma multiforme (GBM) from literature search and pre- versus post-CRT data
in the current analysis starting with literature evidence and progressing to markers present in the proteomic panel employed in the current analysis and
onto markers significant to GBM in the context of alteration with standard of care management. (B) Commonly studied serum inflammatory biomarkers
in GBMs as represented (clockwise) by acute phase reactants, inflammatory cytokines, brain specific expression biomarkrs and in relationship to the
administration of radiaiton therapy. Evolving areas of overlap persist amongst these markers subject to ongoing data evolution.
A B
Figure 2. (A) Pre-CRT serum measurements (log10 mean RFU values) for selected proteins. Grey boxes indicate serum proteins altered with CRT.
(B) Ingenuity pathway analysis volcano plot of serum inflammatory biomarkers pre- versus post-CRT. Green indicates a decrease in measured values, and
red indicates an increase. Labels are provided for proteins with log2RFU alterations outside the range (−0.1 – 0.1). The 10 most altered markers—albumin,
IL-13, GFAP, TNF-α, VCAM-1, Parkinson’s disease-1, CRP, kininogen, IL-1b, and IL-10—are statistically significant (P < 0.05).
Abbreviations: CRT: Chemoradiation therapy; GFAP: Glial fibrillary protein; IL: Interleukin; RFU: Relative fluorescence units; TNF-α: Tumor necrosis
factor alpha; VCAM-1: Vascular cell adhesion molecule 1.
corticosteroids (Table S3 and Figure S3) suggested no and VCAM1), these correlations were generally weak. Two
impact of these parameters on serum measurements. isoforms of GFAP were identified in the panel (Figure S4).
While some statistically significant correlations were Both share the same Entrez Gene ID (2670). However,
identified (TNF-α, IL-10, IL-13, GFAP, VCAM1, and the Sequence ID, which is the unique protein identifier,
Human leukocyte antigen [HLA-G]), as well as with distinguishes the two isoforms (20126 – 19 and 3034 – 1).
respect to corticosteroid administration (NFκB, PD-1, The 3034 – 1 isoform exhibited higher expression levels
Volume 3 Issue 3 (2024) 5 doi: 10.36922/gpd.3580