
Page 106 - GPD-3-3
P. 106
Gene & Protein in Disease Exploring serum inflammatory biomarkers in GBM
compared to 20126 – 19, which exhibited little variability pre-CRT. However, these interactions were not maintained
across patients. The 3034 – 1 isoform was significantly post-CRT, with only one significant inverse association with
altered with CRT (Figure 2), while the 20126 – 19 isoform nuclear factor kappa B (NF-κB) observed post-treatment.
showed no significant alteration (Figure S3). Although IL-6 alteration with CRT was not statistically
significant, and IL-13 met both the fold change and
3.2. Interaction between serum inflammatory P-value cutoffs (Figure 2), IL-6 exhibited more significant
biomarkers at baseline and post-CRT alterations associations with other biomarkers (VCAM-1, TNF-α,
We compared serum measurements from this study to SAA, HLA-G, I kappa B kinase kappa, Prostaglandin E
published data, which typically reports measurements synthase 2 [PGES2], and PD-1), both pre-CRT and post-
taken before the administration of SOC treatment, such CRT than IL-13 (Figure 3B). The interactions involving
as in tumor tissue samples. This analysis examined pre- IL-13 and other markers showed unique trends compared
CRT levels and interactions between markers at baseline, to those of IL-6 and other markers, particularly with
as well as their alterations after SOC CRT, to explore NF-κB (Figure 3). Notable additional interactions include
potential mechanistic connections. The analysis revealed direct correlations between alteration in CRP with SAA
that albumin was inversely associated with CRP both and IL-6, IL-6 with fibrinogen and CRP at baseline, and
before and after CRT, inversely associated with GFAP only inverse correlations between IL-6, IL-10, and IL-13. SAA
before CRT, and inversely associated with fibrinogen only mirrored the IL-6 interaction with albumin and CRP.
after CRT (Figure 3). Albumin was also directly associated We also noted that both IL-13 and IL-6 have positive
with SAA and inversely associated with VCAM-1, during correlations with TNF-α, while IL-10, IL-1b, and PGES2
both pre- and pro-CRT. IL-6 demonstrated a number of have negative correlations.
significant interactions with CRP, fibrinogen, GFAP, and The pre-CRT values and post-CRT alterations in protein
IL-10, both at baseline and following CRT (Figure 3). In levels are visualized in 3D plots (Figure 4) for acute phase
post-CRT, CRP exhibited strong interactions with several proteins (CRP, albumin) and GFAP (Figure 4A and C), as
molecules: Fibrinogen, IL-10, IL-1b, IL-6, PD-1, SAA, well as IL-6, VCAM-1, and TNF-α (Figure 4B and D).
TNF-α, and VCAM-1. TNF-α also exhibited several CRP levels exhibit notable variation between patients pre-
interactions both pre-CRT and post-CRT, second in CRT, compared to albumin and GFAP levels (Figure 4A).
number only to CRP. The baseline interaction between Following CRT, the alterations in CRP (predominantly
the APRs, albumin, CRP, and the neuroinflammation decreased) and albumin (predominantly increased) are
indicator GFAP (Figure 3A) revealed that GFAP interacted visualized, with GFAP alterations adding a third dimension
with several markers (albumin, CD14, fibrinogen, IL-6) (Figure 4C). It is important to note that for some patients,
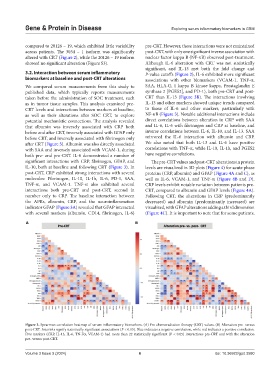
A B
Figure 3. Spearman correlation heatmap of serum inflammatory biomarkers. (A) Pre-chemoradiation therapy (CRT) values. (B) Alteration pre- versus
post-CRT. Asterisks signify statistically significant associations (P < 0.05). Blue indicates a negative correlation, while red indicates a positive correlation.
Five markers (CRP, IL-13, IL-6, TN-Fα, VCAM-1) had more than 22 statistically significant (P < 0.05) interactions pre-CRT and with the alteration
pre- versus post-CRT.
Volume 3 Issue 3 (2024) 6 doi: 10.36922/gpd.3580