
Page 103 - GPD-3-3
P. 103
Gene & Protein in Disease Exploring serum inflammatory biomarkers in GBM
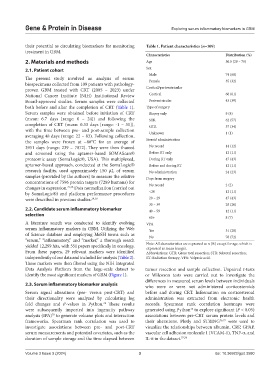
their potential as circulating biomarkers for monitoring Table 1. Patient characteristics (n=109)
treatment in GBM.
Characteristics Distribution (%)
2. Materials and methods Age 56.5 (29 – 79)
2.1. Patient cohort Sex
Male 74 (68)
The present study involved an analysis of serum Female 35 (32)
biospecimens collected from 109 patients with pathology-
proven GBM treated with CRT (2005 – 2023) under Cortical/periventricular
National Cancer Institute (NIH) Institutional Review Cortical 66 (61)
Board-approved studies. Serum samples were collected Periventricular 43 (39)
both before and after the completion of CRT (Table 1). Type of surgery
Serum samples were obtained before initiation of CRT Biopsy only 9 (8)
(mean: 6.7 days [range: 0 – 24]) and following the STR 62 (57)
completion of CRT (mean: 0.33 days [range: -1 – 31]), GTR 37 (34)
with the time between pre- and post-sample collection Unknown 1 (1)
averaging 48 days (range: 22 – 83). Following collection,
the samples were frozen at −80°C for an average of Steroid administration
3951 days (range: 239 – 7072). They were then thawed No record 14 (12)
and screened using the aptamer-based SOMAScan® Before RT only 12 (11)
proteomic assay (SomaLogic®, USA). This multiplexed, During RT only 47 (43)
aptamer-based approach, conducted at the SomaLogic® Before and during RT 12 (11)
research facility, used approximately 150 μL of serum No administration 24 (23)
samples (provided by the authors) to measure the relative Days from surgery
concentrations of 7596 protein targets (7289 humans) for
changes in expression. 27,28 Data normalization (carried out No record 2 (2)
by SomaLogic®) and platform performance procedures <20 12 (11)
were described in previous studies. 29,30 20 – 29 47 (43)
30 – 39 28 (26)
2.2. Candidate serum inflammatory biomarker 40 – 59 12 (11)
selection
60+ 8 (7)
A literature search was conducted to identify evolving VPA
serum inflammatory markers in GBM. Utilizing the Web Yes 31 (28)
of Science database and employing MeSH terms such as No 78 (72)
“serum,” “inflammatory,” and “marker,” a thorough search
yielded 12,299 hits, with 551 papers specifically in oncology. Note: All characteristics are expressed as n (%) except for age, which is
expressed as mean (range).
From these papers, 29 relevant markers were identified Abbreviations: GTR: Gross total resection; STR: Subtotal resection;
independently of our data and included for analysis (Table 2). RT: Radiation therapy; VPA: Valproic acid.
These markers were then filtered using the NIH Integrated
Data Analysis Platform from the large-scale dataset to tumor resection and sample collection. Unpaired t-tests
identify the most significant markers of GBM (Figure 1). or Wilcoxon tests were carried out to investigate the
differences in measured serum levels between individuals
2.3. Serum inflammatory biomarker analysis who were or were not administered corticosteroids
Serum signal alterations (pre- versus post-CRT) and before and during CRT. Information on corticosteroid
their directionality were analyzed by calculating log administration was extracted from electronic health
fold changes and P-values in Python. These results records. Spearman rank correlation heatmaps were
74
were subsequently imported into ingenuity pathway generated using Python to explore significant (P < 0.05)
74
analysis (IPA) to generate volcano plots and interaction associations between pre-CRT serum protein levels and
75
frameworks. Spearman rank correlation was used to their alterations. Plotly and STRING 76,77 were used to
investigate associations between pre- and post-CRT visualize the relationships between albumin, CRP, GFAP,
serum measurements and potential covariates, such as the vascular cell adhesion molecule 1 (VCAM-1), TNF-α, and
duration of sample storage and the time elapsed between IL-6 in the dataset. 77,78
Volume 3 Issue 3 (2024) 3 doi: 10.36922/gpd.3580