
Page 93 - GPD-3-3
P. 93
Gene & Protein in Disease Perineural invasion in prostate cancer
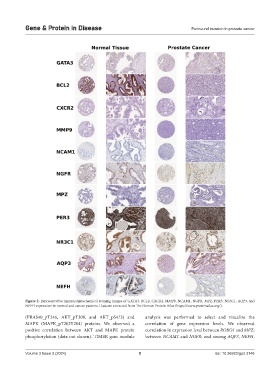
Figure 2. Representative immunohistochemical staining images of GATA3, BCL2, CXCR2, MMP9, NCAM1, NGFR, MPZ, PER3, NR3C1, AQP3, and
NEFH expression in normal and cancer patients. Data are extracted from The Human Protein Atlas (https://www.proteinatlas.org/).
(PRAS40_pT246, AKT_pT308, and AKT_pS473) and analysis was performed to select and visualize the
MAPK (MAPK_pT202Y204) proteins. We observed a correlation of gene expression levels. We observed
positive correlation between AKT and MAPK protein correlation in expression level between ROBO1 and MPZ;
phosphorylation (data not shown). TIMER gene module between NCAM1 and NGFR; and among AQP3, NEFH,
Volume 3 Issue 3 (2024) 5 doi: 10.36922/gpd.3146