
Page 22 - GTM-1-1
P. 22
Global Translational Medicine Anticancer effect of S. xanthocarpum on KB cell line
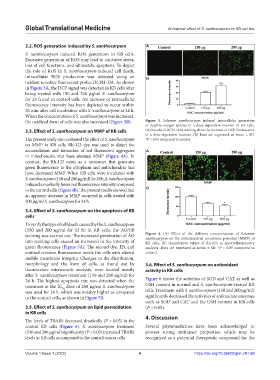
3.2. ROS generation induced by S. xanthocarpum A
S. xanthocarpum induced ROS generation in KB cells.
Excessive generation of ROS may lead to oxidative stress,
loss of cell functions, and ultimately, apoptosis. To depict
the role of ROS in S. xanthocarpum-induced cell death,
intracellular ROS production was detected using an B
oxidant sensitive fluorescent probe, DCFH-DA. As shown
in Figure 3A, the DCF signal was detected in KB cells after
being treated with 150 and 200 µg/ml S. xanthocarpum
for 24 h and in control cells. An increase of intracellular
fluorescence intensity has been depicted to occur within
20 min after cell incubation with S. xanthocarpum at 24 h.
When the concentration of S. xanthocarpum was increased,
the oxidized form of cells was also increased (Figure 3B). Figure 3. Solanum xanthocarpum induced intracellular generation
of reactive oxygen species in a dose-dependent manner in KB cells.
3.3. Effect of S. xanthocarpum on MMP of KB cells (A) Results of DCFH‐DA staining show the increase of DCF fluorescence
in a dose‐dependent manner. (B) Data are expressed as mean ± SD.
The present study also evaluated the effect of S. xanthocarpum *P < 0.05 compared to control.
on MMP in KB cells. Rh-123 dye was used to detect the
accumulation and formation of red fluorescent aggregates A
in mitochondria that have elevated MMP (Figure 4A). In
contrast, the Rh-123 exists as a monomer that generates
green fluorescence in the cytoplasm and mitochondria that
have decreased MMP. When KB cells were incubated with
S. xanthocarpum (150 and 200 µg/ml) for 24 h, S. xanthocarpum
induced a markedly lower red fluorescence intensity compared
to the control cells (Figure 4B). The present results showed that B
an apparent decrease in MMP occurred in cells treated with
200 µg/ml S. xanthocarpum for 24 h.
3.4. Effect of S. xanthocarpum on the apoptosis of KB
cells
To verify the type of cell death caused by the S. xanthocarpum
(150 and 200 µg/ml for 12 h) in KB cells, the AO/EB
staining was carried out. The increased penetration of AO Figure 4. (A) Effect of the different concentrations of Solanum
xanthocarpum on the mitochondrial membrane potential (MMP) of
into residing cells caused an increased in the intensity of KB cells. (B) Quantitative values of Rh‐123 in spectrofluorometry
green fluorescence (Figure 5A). The second dye, EB, and analyses. Data are expressed as mean ± SD. *P < 0.05 compared to
emitted crimson fluorescence inside the cells with altered control.
mobile membrane integrity. Changes in the distribution,
morphology and the form of cells, as found out by 3.6. Effect of S. xanthocarpum on antioxidant
fluorescence microscopic analysis, were located mostly activity in KB cells
after S. xanthocarpum treatment (150 and 200 µg/ml) for
24 h. The highest apoptosis rate was detected when the Figure 6 shows the activities of SOD and CAT as well as
treatment at the IC dose of 200 µg/ml S. xanthocarpum GSH content in normal and S. xanthocarpum-treated KB
50
was used for 24 h, which was notably higher as compared cells. Treatment with S. xanthocarpum (150 and 200 µg/ml)
to the control cells, as shown in Figure 5B. significantly decreased the activities of antioxidant enzymes
such as SOD and CAT and the GSH content in KB cells
3.5. Effect of S. xanthocarpum on lipid peroxidation (P < 0.05).
in KB cells
The levels of TBARS decreased drastically (P < 0.05) in the 4. Discussion
control KB cells (Figure 6). S. xanthocarpum treatment Several phytomedicines have been acknowledged to
(150 and 200 µg/ml) significantly (P < 0.05) increased TBARS possess strong antitumor properties, which may be
levels in KB cells as compared to the control cancer cells. recognized as a potential therapeutic compound for the
Volume 1 Issue 1 (2022) 4 https://doi.org/10.36922/gtm.v1i1.68