
Page 23 - GTM-1-2
P. 23
Global Translational Medicine IGF-1 and IGFBP-3 levels are correlated with eGFR
2.3. Biochemical indicators 3. Results
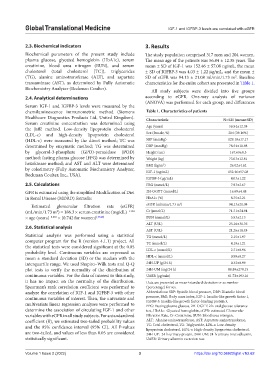
Biochemical parameters of the present study include The study population comprised 317 men and 204 women.
plasma glucose, glycated hemoglobin (HbA1c), serum The mean age of the patients was 56.84 ± 12.38 years. The
creatinine, blood urea nitrogen (BUN), and serum mean ± SD of IGF-1 was 152.46 ± 57.08 ng/mL, the mean
cholesterol (total cholesterol [TC]), triglycerides ± SD of IGFBP-3 was 4.03 ± 1.22 μg/mL, and the mean ±
(TG), alanine aminotransferase (ALT), and aspartate SD of eGFR was 94.13 ± 21.08 ml/min/1.73 m . Baseline
2
transaminase (AST), as determined by Fully Automatic characteristics for the entire cohort are presented in Table 1.
Biochemistry Analyzer (Beckman Coulter).
All study subjects were divided into five groups
2.4. Analytical determinations according to eGFR. One-way analysis of variance
(ANOVA) was performed for each group, and differences
Serum IGF-1 and IGFBP-3 levels were measured by the
chemiluminescence immunometric method (Siemens Table 1. Characteristics of patients
Healthcare Diagnostics Products Ltd, United Kingdom). Characteristic N=521 (mean±SD)
Serum creatinine concentration was determined using
the Jaffé method. Low-density lipoprotein cholesterol Age (years) 56.84±12.38
(LDL-c) and high-density lipoprotein cholesterol Sex (female, %) 204 (39.16%)
(HDL-c) were measured by the direct method; TC was SBP (mmHg) 129.18±17.17
determined by enzymatic method; TG was determined DBP (mmHg) 78.54±10.98
by glycerol-3-phosphate (GPO)-peroxidase (POD) Height (cm) 167.69±8.3
method; fasting plasma glucose (FPG) was determined by Weight (kg) 73.03±12.81
hexokinase method; and AST and ALT were determined BMI (kg/m ) 26.02±4.62
2
by colorimetry (Fully Automatic Biochemistry Analyzer, IGF-1 (ng/mL) 152.46±57.08
Beckman Coulter, Inc., USA).
IGFBP-3 (μg/mL) 4.03±1.22
2.5. Calculations FBG (mmol/L) 7.93±2.67
GFR is estimated using the simplified Modification of Diet 2H-OGTT (mmol/L) 16.69±4.48
in Renal Disease (MDRD) formula: HbA1c (%) 8.75±2.21
2
Estimated glomerular filtration rate (eGFR) eGFR (ml/min/1.73 m ) 94.13±21.08
(mL/min/1.73 m ) = 186.3 × serum creatinine (mg/dL) −1.154 Cr (μmol/L) 71.71±24.94
2
× age (years) −0.203 × (0.742 for women) [19,20] BUN (mmol/L) 5.83±2.13
ALT (U/L) 25.16±31.76
2.6. Statistical analysis
AST (U/L) 21.26±18.48
Statistical analysis was performed using a statistical TG (mmol/L) 2.15±1.97
computer program for the R (version 4.1.1) project. All TC (mmol/L) 4.19±1.21
the statistical tests were considered significant at the 0.05
probability level. Continuous variables are expressed as LDL-c (mmol/L) 2.71±0.96
mean ± standard deviation (SD) or the median with the HDL-c (mmol/L) 0.98±0.27
interquartile range. We used Shapiro–Wilk tests and Q-Q 24H-UP (g/24 h) 0.32±0.99
plot tests to verify the normality of the distribution of 24H-UM (mg/24 h) 88.89±278.15
continuous variables. For the data of interest in this study, UAER (μg/min) 61.73±193.16
it has no impact on the normality of the distribution. Data are presented as mean±standard deviation or as number
Spearman’s rank correlation coefficient was performed to (percentage) for sex.
analyze the correlation of IGF-1 and IGFBP-3 with other Abbreviations: SBP: Systolic blood pressure, DBP: Diastolic blood
continuous variables of interest. Then, the univariate and pressure, BMI: Body mass index, IGF-1: Insulin-like growth factor 1,
multivariate linear regression analyses were performed to IGFBP-3: Insulin-like growth factor-binding protein 3,
FPG: Fasting plasma glucose, 2H-OGTT: 2 h-oral glucose tolerance
determine the association of circulating IGF-1 and other test, HbA1c: Glycated hemoglobin, eGFR: estimated Glomerular
variables with eGFR in all study subjects. For a standardized Filtration Rate, Cr: Creatinine, BUN: Blood urea nitrogen,
coefficient (B), we estimated two-tailed probability values ALT: Alanine aminotransferase, AST: Aspartate aminotransferase,
and the 95% confidence interval (95% CI). All P-values TC: Total cholesterol, TG: Triglyceride, LDL-c: Low-density
lipoprotein cholesterol, HDL-c: High-density lipoprotein cholesterol,
are two-tailed, and values of less than 0.05 are considered 24H-UP: 24-h urinary protein, 24H-UM: 24-h urinary microalbumin,
statistically significant. UAER: Urinary albumin excretion rate.
Volume 1 Issue 2 (2022) 3 https://doi.org/10.36922/gtm.v1i2.62