
Page 24 - GTM-1-2
P. 24
Global Translational Medicine IGF-1 and IGFBP-3 levels are correlated with eGFR
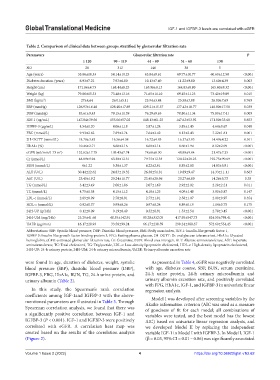
Table 2. Comparison of clinical data between groups stratified by glomerular filtration rate
Parameters Glomerular filtration rate P
≥ 120 90 – 119 61 – 89 31 – 60 ≤30
NO 28 312 146 30 5
Age (years) 35.86±10.53 54.14±10.23 63.84±9.61 69.77±10.77 60.60±12.58 <0.001
Diabetes duration (years) 6.93±7.22 7.93±6.80 10.13±7.49 11.22±9.80 13.60±4.39 0.003
Height (cm) 171.86±6.73 168.44±8.23 165.96±8.13 164.83±8.80 165.60±9.32 <0.001
Weight (kg) 79.86±15.33 73.40±13.16 71.65±11.10 69.45±11.23 73.40±19.89 0.015
2
BMI (kg/m ) 27±4.64 26.01±5.11 25.94±3.44 25.50±3.88 26.80±7.69 0.769
SBP (mmHg) 126.93±16.48 128.40±17.69 129.21±15.37 137.43±18.77 140.00±17.58 0.039
DBP (mmHg) 83.61±9.43 79.15±11.39 76.29±9.63 78.80±11.34 75.80±17.41 0.009
IGF-1 (ng/mL) 147.84±39.56 155.06±57.02 148.13±61.25 147.63±53.92 171.80±33.68 0.653
IGFBP-3 (μg/mL) 4.54±1.20 4.06±1.18 3.87±1.24 3.85±1.45 4.64±0.67 0.048
FBG (mmol/L) 9.93±2.82 7.89±2.74 7.64±2.42 8.13±2.43 7.22±1.81 0.001
2H-OGTT (mmol/L) 18.78±3.83 16.56±4.38 16.72±4.83 16.37±3.93 14.49±4.22 0.101
HbA1c (%) 10.46±2.71 8.68±2.16 8.60±2.14 8.60±1.94 8.12±2.09 <0.001
eGFR (ml/min/1.73 m ) 132.62±17.78 103.43±7.74 78.68±8.30 48.80±9.04 21.47±7.35 <0.001
2
Cr (μmol/L) 48.89±9.94 63.30±12.31 79.75±12.33 120.22±28.23 192.75±99.69 <0.001
BUN (mmol/L) 4±1.22 5.38±1.37 6.22±2.01 8.85±2.80 14.03±5.91 <0.001
ALT (U/L) 30.44±22.62 24.83±19.32 26.30±51.81 19.89±9.47 14.33±11.11 0.663
AST (U/L) 23.45±19.2 20.24±11.77 23.45±28.96 20.27±6.89 14.26±5.73 0.38
TG (mmol/L) 3.42±3.49 2.06±1.86 2.07±1.69 2.92±2.02 2.28±2.21 0.011
TC (mmol/L) 4.75±1.58 4.15±1.12 4.18±1.25 4.09±1.48 3.90±0.87 0.147
LDL-c (mmol/L) 2.89±0.99 2.70±0.91 2.73±1.01 2.58±1.07 2.00±0.97 0.354
HDL-c (mmol/L) 0.92±0.37 0.99±0.26 0.97±0.24 0.89±0.19 1.14±0.75 0.175
24H-UP (g/24h) 0.12±0.09 0.19±0.49 0.32±0.91 1.53±2.54 2.78±3.45 <0.001
24H-UM (mg/24h) 23.29±41.66 48.35±142.91 95.28±332.05 417.95±547.73 824.55±798.41 <0.001
UAER (μg/min) 16.17±28.93 33.58±99.24 66.17±230.59 290.24±380.37 572.60±554.45 <0.001
Abbreviations: SBP: Systolic blood pressure, DBP: Diastolic blood pressure, BMI: Body mass index, IGF-1: Insulin-like growth factor 1,
IGFBP-3: Insulin-like growth factor-binding protein 3, FPG: Fasting plasma glucose, 2H-OGTT: 2h-oral glucose tolerance test, HbA1c: Glycated
hemoglobin, eGFR: estimated glomerular filtration rate, Cr: Creatinine, BUN: Blood urea nitrogen, ALT: Alanine aminotransferase, AST: Aspartate
aminotransferase, TC: Total cholesterol, TG: Triglyceride, LDL-c: Low-density lipoprotein cholesterol, HDL-c: High-density lipoprotein cholesterol,
24H-UP: 24-h urinary protein, 24H-UM: 24-h urinary microalbumin, UAER: Urinary albumin excretion rate
were found in age, duration of diabetes, weight, systolic As presented in Table 4, eGFR was negatively correlated
blood pressure (SBP), diastolic blood pressure (DBP), with age, diabetes course, SBP, BUN, serum creatinine,
IGFBP-3, FBG, HbA1c, BUN, TG, 24-h urine protein, and 24-h urine protein, 24-h urinary microalbumin and
urinary albumin (Table 2). urinary albumin excretion rate, and positively correlated
with FPG, HbA1c, IGF-1, and IGFBP-3 in univariate linear
In this study, the Spearman’s rank correlation regression analysis.
coefficients among IGF-1and IGFBP-3 with the above-
Model I was developed after screening variables by the
mentioned parameters are illustrated in Table 3. Through Akaike information criterion (AIC was used as a measure
Spearman correlation analysis, we found that there was of goodness of fit for each model; all combinations of
a significantly positive correlation between IGF-1 and variables were tested, and the best model has the lowest
IGFBP-3 (P < 0.001). IGF-1 and IGFBP-3 were positively AIC) based on univariate linear regression analysis, and
correlated with eGFR. A correlation heat map was we developed Model II by replacing the independent
created based on the results of the correlation analysis variable IGF-1 in Model I with IGFBP-3. In Model I, IGF-1
(Figure 2). (β = 0.03, 95% CI = 0.01 – 0.06) was significantly associated
Volume 1 Issue 2 (2022) 4 https://doi.org/10.36922/gtm.v1i2.62