
Page 26 - GTM-1-2
P. 26
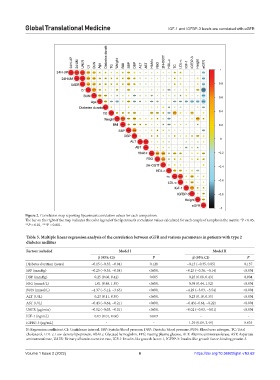
Global Translational Medicine                                IGF-1 and IGFBP-3 levels are correlated with eGFR


            Figure 2. Correlation map reporting Spearman’s correlation values for each comparison.
            The bar on the right of the map indicates the color legend of the Spearman’s correlation values calculated for each couple of samples in the matrix. *P < 0.05,
            **P < 0.01, ***P < 0.001.

            Table 5. Multiple linear regression analysis of the correlation between eGFR and various parameters in patients with type 2
            diabetes mellitus
            Factors included                        Model I                                 Model II
                                           β (95% CI)             P                β (95% CI)             P
            Diabetes duration (years)   −0.15 (−0.35, −0.04)     0.128           −0.15 (−0.35, 0.05)     0.137
            SBP (mmHg)                  −0.25 (−0.35, −0.04)    <0.001          −0.25 (−0.36, −0.14)    <0.001
            DBP (mmHg)                   0.25 (0.08, 0.42)       0.005           0.25 (0.08, 0.43)       0.004
            FBG (mmol/L)                 1.01 (0.48, 1.55)      <0.001           0.98 (0.44, 1.52)      <0.001
            BUN (mmol/L)                −4.37 (−5.12, −3.63)    <0.001          −4.29 (−5.03, −3.54)    <0.001
            ALT (U/L)                    0.23 (0.11, 0.35)      <0.001           0.23 (0.10, 0.35)      <0.001
            AST (U/L)                   −0.43 (−0.64, −0.21)    <0.001          −0.43(−0.64, −0.22)     <0.001
            UAER (μg/min)               −0.02 (−0.03, −0.01)    <0.001          −0.02 (−0.03, −0.01)    <0.001
            IGF-1 (ng/mL)                0.03 (0.01, 0.06)       0.009                -                   -
            IGFBP-3 (μg/mL]                   -                   -              1.29 (0.09, 2.49)       0.035
            Β: Regression coefficient, CI: Confidence interval, SBP: Systolic blood pressure, DBP: Diastolic blood pressure, BUN: Blood urea nitrogen, TC: Total
            cholesterol, LDL-c: Low-density lipoprotein, HbA1c: Glycated hemoglobin, FPG: Fasting plasma glucose, ALT: Alanine aminotransferase, AST: Aspartate
            aminotransferase, UAER: Urinary albumin excretion rate, IGF-1: Insulin-like growth factor-1, IGFBP-3: Insulin-like growth factor-binding protein-3


            Volume 1 Issue 2 (2022)                         6                       https://doi.org/10.36922/gtm.v1i2.62