
Page 45 - GTM-1-2
P. 45
Global Translational Medicine Cirrhosis and hepatocellular carcinoma
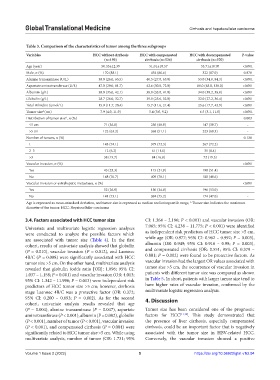
Table 3. Comparison of the characteristics of tumor among the three subgroups
Variables HCC without cirrhosis HCC with compensated HCC with decompensated P‑value
(n=193) cirrhosis (n=524) cirrhosis (n=370)
Age (year) 50.35±12.39 51.01±10.57 53.71±10.70 <0.001
Male, n (%) 170 (88.1) 454 (86.6) 322 (87.0) 0.878
Alanine transaminase (U/L) 39.0 (26.0, 65.5) 40.5 (27.0, 65.0) 53.0 (34.0, 84.3) <0.001
Aspartate aminotransferase (U/L) 47.0 (29.0, 81.7) 42.6 (30.0, 72.0) 80.0 (48.8, 138.0) <0.001
Albumin (g/L) 39.0 (35.0, 42.1) 38.0 (35.0, 41.0) 34.0 (30.2, 38.0) <0.001
Globulin (g/L) 28.7 (26.0, 32.7) 29.0 (25.6, 32.0) 32.0 (27.2, 36.4) <0.001
Total Bilirubin (umol/L) 15.9 (11.7, 20.4) 15.7 (11.6, 21.4) 25.6 (17.7, 42.9) <0.001
Tumor size*(cm) 7.9 (4.0, 11.9) 5.4 (3.0, 9.2) 6.5 (3.1, 11.0) <0.001
Distribution of tumor size*, n (%) 0.003
≤5 cm 71 (36.8) 256 (48.9) 147 (39.7) -
>5 cm 122 (63.2) 268 (51.1) 223 (60.3) -
Number of tumors, n (%) 0.130
1 143 (74.1) 379 (72.3) 267 (72.2)
2–3 12 (6.2) 61 (11.6) 31 (8.4)
>3 38 (19.7) 84 (16.0) 72 (19.5)
Vascular invasion, n (%) <0.001
Yes 45 (23.3) 115 (21.9) 190 (51.4)
No 148 (76.7) 409 (78.1) 180 (48.6)
Vascular invasion or extrahepatic metastases, n (%) <0.001
Yes 52 (26.9) 130 (24.8) 196 (53.0) -
No 141 (73.1) 394 (75.2) 174 (47.0) -
Age is expressed as mean±standard deviation, and tumor size is expressed as median and interquartile range, * Tumor size indicates the maximum
diameter of the tumor. HCC: Hepatocellular carcinoma
3.4. Factors associated with HCC tumor size CI: 1.364 – 2.196; P < 0.001) and vascular invasion (OR:
7.065; 95% CI: 4.238 – 11.775; P < 0.001) were identified
Univariate and multivariate logistic regression analyses
were conducted to analyze the possible factors which as independent risk predictors of HCC tumor size >5 cm,
are associated with tumor size (Table 4). In the first while age (OR: 0.977; 95% CI: 0.962 – 0.992; P = 0.003),
cohort, results of univariate analysis showed that globulin albumin (OR: 0.949; 95% CI: 0.916 – 0.98; P = 0.003),
(P = 0.010), vascular invasion (P = 0.012), and Laennec and compensated cirrhosis (OR: 0.551; 95% CI: 0.379 –
4B/C (P = 0.008) were significantly associated with HCC 0.801; P = 0.002) were found to be protective factors. As
tumor size >5 cm. On the other hand, multivariate analysis vascular invasion had the largest OR values associated with
revealed that globulin (odds ratio [OR]: 1.096; 95% CI: tumor size >5 cm, the occurrence of vascular invasion in
1.037 – 1.158; P = 0.001) and vascular invasion (OR: 4.013; patients with different tumor size was compared as shown
95% CI: 1.342 – 11.996; P = 0.013) were independent risk in Table 5. In short, patients with larger tumor size tend to
predictors of HCC tumor size >5 cm; however, cirrhosis have higher rates of vascular invasion, confirmed by the
stage Laennec 4B/C was a protective factor (OR: 0.372; multivariate logistic regression analysis.
95% CI: 0.200 – 0.693; P = 0.002). As for the second 4. Discussion
cohort, univariate analysis results revealed that age
(P = 0.004), alanine transaminase (P = 0.047), aspartate Tumor size has been considered one of the prognostic
aminotransferase (P < 0.001), albumin (P = 0.002), globulin factors for HCC [11,12] . This study demonstrated that
(P < 0.001), number of tumor (P < 0.001), vascular invasion the presence of liver cirrhosis, especially compensated
(P < 0.001), and compensated cirrhosis (P = 0.004) were cirrhosis, could be an important factor that is negatively
significantly related to HCC tumor size >5 cm. While using associated with the tumor size in HBV-related HCC.
multivariate analysis, number of tumor (OR: 1.731; 95% Conversely, the vascular invasion showed a positive
Volume 1 Issue 2 (2022) 5 https://doi.org/10.36922/gtm.v1i2.94