
Page 43 - GTM-1-2
P. 43
Global Translational Medicine Cirrhosis and hepatocellular carcinoma
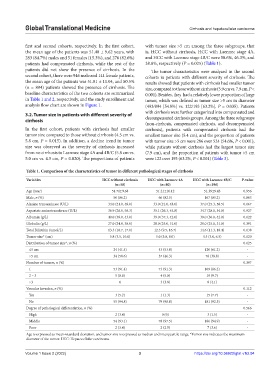
first and second cohorts, respectively. In the first cohort, with tumor size >5 cm among the three subgroups, that
the mean age of the patients was 51.40 ± 9.62 years, with is, HCC without cirrhosis, HCC with Laennec stage 4A,
283 (84.7%) males and 51 females (15.3%), and 276 (82.6%) and HCC with Laennec stage 4B/C were 58.6%, 46.3%, and
patients had compensated cirrhosis, while the rest of the 38.8%, respectively (P = 0.025) (Table 1).
patients did not show the presence of cirrhosis. In the The tumor characteristics were analyzed in the second
second cohort, there were 946 male and 141 female patients, cohorts in patients with different severity of cirrhosis. The
the mean age of the patients was 51.81 ± 11.04, and 80.5% results showed that patients with cirrhosis had smaller tumor
(n = 894) patients showed the presence of cirrhosis. The size, compared to those without cirrhosis (5.9 cm vs. 7.9 cm, P <
baseline characteristics of the two cohorts are summarized 0.001). Besides, they had a relatively lower proportion of large
in Table 1 and 2, respectively, and the study enrollment and tumor, which was defined as tumor size >5 cm in diameter
analysis flow chart are shown in Figure 1. (493/894 [54.9%] vs. 122/193 [63.2%], P = 0.035). Patients
with cirrhosis were further categorized into compensated and
3.2. Tumor size in patients with different severity of
cirrhosis decompensated cirrhosis groups. Among the three subgroups
(non-cirrhosis, compensated cirrhosis, and decompensated
In the first cohort, patients with cirrhosis had smaller cirrhosis), patients with compensated cirrhosis had the
tumor size compared to those without cirrhosis (4.5 cm vs. smallest tumor size (5.4 cm), and the proportion of patients
5.8 cm, P = 0.015). In addition, a decline trend in tumor with tumor size >5 cm were 286 over 524 (54.6%, P < 0.001),
size was observed as the severity of cirrhosis increased while patients without cirrhosis had the largest tumor size
from no cirrhosis to Laennec stage 4A and 4B/C (5.8 cm vs. (7.9 cm), and the proportion of patients with tumor >5 cm
5.0 cm vs. 4.5 cm, P = 0.020). The proportions of patients were 122 over 193 (63.2%, P < 0.001) (Table 3).
Table 1. Comparison of the characteristics of tumor in different pathological stages of cirrhosis
Variables HCC without cirrhosis HCC with Laennec 4A HCC with Laennec 4B/C P‑value
(n=58) (n=80) (n=196)
Age (year) 51.71±9.68 51.21±10.12 51.39±9.43 0.956
Male, n (%) 50 (86.2) 66 (82.5) 167 (85.2) 0.803
Alanine transaminase (U/L) 34.0 (21.0, 48.0) 33.0 (21.0, 48.0) 37.0 (25.3, 58.5) 0.067
Aspartate aminotransferase (U/L) 36.9 (26.0, 56.3) 35.1 (26.3, 44.8) 34.7 (28.0, 54.0) 0.927
Albumin (g/L) 40.0 (38.0, 43.0) 39.0 (37.3, 42.0) 39.0 (36.0, 42.0) 0.022
Globulin (g/L) 27.0 (24.8, 30.0) 28.0 (25.0, 31.0) 28.0 (25.0, 31.0) 0.391
Total Bilirubin (umol/L) 13.3 (10.7, 17.8) 12.3 (9.5, 16.7) 14.6 (11.3, 18.4) 0.038
Tumor size* (cm) 5.8 (3.5, 10.0) 5.0 (3.0, 8.0) 4.5 (3.0, 6.5) 0.020
Distribution of tumor size*, n (%) 0.025
≤5 cm 24 (41.4) 43 (53.8) 120 (61.2) -
>5 cm 34 (58.6) 37 (46.3) 76 (38.8) -
Number of tumors, n (%) 0.397
1 53 (91.4) 73 (91.3) 169 (86.2)
2 – 3 5 (8.6) 4 (5.0) 19 (9.7)
>3 0 3 (3.8) 8 (4.1)
Vascular invasion, n (%) 0.112
Yes 3 (5.2) 1 (1.3) 15 (7.7) -
No 55 (94.8) 79 (98.8) 181 (92.3) -
Degree of pathological differentiation, n (%) 0.566
High 2 (3.4) 0 (0) 3 (1.5) -
Middle 54 (93.1) 78 (97.5) 186 (94.9) -
Poor 2 (3.4) 2 (2.5) 7 (3.6) -
Age is expressed as mean±standard deviation, and tumor size is expressed as median and interquartile range. *Tumor size indicates the maximum
diameter of the tumor. HCC: Hepatocellular carcinoma
Volume 1 Issue 2 (2022) 3 https://doi.org/10.36922/gtm.v1i2.94