
Page 13 - GTM-2-3
P. 13
Global Translational Medicine Hydrogen for acute lung injury
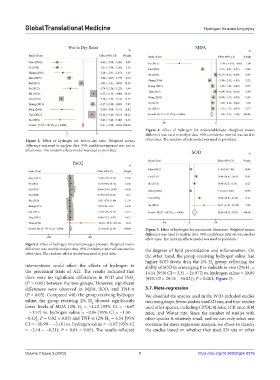
Figure 4. Effect of hydrogen for malondialdehyde. Weighted means
difference was used to analyze data. 95% confidence interval was used as
Figure 2. Effect of hydrogen for wet-to-dry ratio. Weighted means effect sizes. The random-effects model was used to pool data.
difference was used to analyze data. 95% confidence interval was use as
effect sizes. The random-effects model was used to pool data.
Figure 5. Effect of hydrogen for superoxide dismutase. Weighted means
difference was used to analyze data. 95% confidence interval was used as
effect sizes. The random-effects model was used to pool data.
Figure 3. Effect of hydrogen for arterial oxygen pressure. Weighted means
difference was used to analyze data. 95% confidence interval was used as the degrees of lipid peroxidation and inflammation. On
effect sizes. The random-effects model was used to pool data.
the other hand, the group receiving hydrogen saline had
higher SOD levels than the 2% H group, reflecting the
2
interventions could affect the effects of hydrogen in ability of SOD in scavenging free radicals in vivo (2% H =
2
the preclinical trials of ALI. The results indicated that 14.14 [95% CI = 3.31 – 24.97]) vs. hydrogen saline = 39.89
there were no significant differences in W/D and PaO [95% CI = 29.76 – 50.02]); P < 0.001; Figure 7).
2
(P > 0.05) between the two groups. However, significant
differences were observed in MDA, SOD, and TNF-α 3.7. Meta-regression
(P < 0.05). Compared with the group receiving hydrogen We classified the species used in the W/D-included studies
saline, the group receiving 2% H showed significantly into two groups: Seven studies used SD rats, and four studies
2
lower levels of MDA (2% H = −4.12 [95% CI = −6.67 used other species, including C57BL/6J mice, ICR mice, KM
2
– −1.57] vs. hydrogen saline = −0.96 [95% CI = −1.50 – mice, and Wistar rats. Since the number of studies with
−0.43]; P = 0.02 < 0.05) and TNF-α (2% H = 6.54 [95% other species is relatively small, and we can only select one
2
CI = −10.99 – −2.10] vs. hydrogen saline = −1.67 [95% CI covariate for meta-regression analysis, we chose to classify
= −3.14 – −0.21); P = 0.04 < 0.05). The results reflected the studies based on whether they used SD rats or other
Volume 2 Issue 3 (2023) 7 https://doi.org/10.36922/gtm.0379