
Page 15 - GTM-2-3
P. 15
Global Translational Medicine Hydrogen for acute lung injury
3.10. Sensitivity analysis peroxidation, scavenging oxygen free radicals, and inhibiting
The stability and reliability of this meta-analysis were expressions of inflammatory factors. Moreover, we also
assessed using the trim and fill plot and sensitivity analysis. found that 2% H exhibited superior effects in reducing
2
In the sensitivity analysis, we systematically omitted one MDA and TNF-α compared to hydrogen saline. However,
study at a time and recalculated the effects of the remaining hydrogen saline outperformed 2% H in terms of SOD levels.
2
studies to assess the potential impact of individual studies The findings suggest that hydrogen and hydrogen saline can
on the overall results. In addition, we examined whether be chosen or combined to optimize treatment efficacy for
there were additional virtual studies in the trim and fill different degrees of ALI (shown in Figure 11)
plot. The results showed that no significant differences 4.1. Interventions that affect the distribution of
were observed after the removal of any single study. hydrogen
Furthermore, the results of the trim and fill plot indicated
that there were no omissions of included studies, further The distribution and concentration of molecular hydrogen
supporting the reliability of the results obtained from this in various organs have been investigated by different
[42]
meta-analysis (Figure 10). researchers. Sun et al. reported that the molecular
hydrogen concentration reached its peak approximately
3.11. Grade evidence assessment 5 min after injecting hydrogen saline into the liver and
[43]
As for the grade evidence of the included indicators, kidneys. In contrast, Liu et al. demonstrated that
W/D, MDA, and SOD have moderate-quality evidence, inhaling 2% H gas resulted in maximum gas levels in the
2
indicating that there is moderate confidence in the
conclusion that the real value is close to the estimated
value. PaO has a low quality, and TNF-α has a very low
2
quality, suggesting that the present paper has reservations
about the credibility of the results for PaO and TNF-α.
2
More detailed information regarding these indicators can
be found in Table 4.
4. Discussion
In the present paper, we performed a meta-analysis and
systematic review of 20 preclinical studies on ALI. Our
findings revealed that both 2% H and hydrogen saline
2
demonstrated effects of significantly reducing the volume
of pulmonary edema, improving hypoxia, repressing lipid
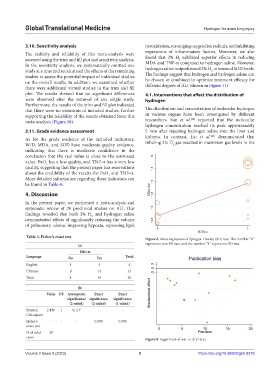
Table 3. Fisher’s exact test Figure 8. Meta-regression of Sprague-Dawley (SD) rats. The number “0”
(a) represents non-SD rats, and the number “1” represents SD rats.
Effects
Language No Yes Total
English 1 5 6
Chinese 0 14 14
Total 1 19 20
(b)
Value DF Asymptotic Exact Exact
significance significance significance
(2‑sided) (2‑sided) (1‑sided)
Pearson 2.456 1 0.117 - -
Chi-square
Fisher’s - - - 0.300 0.300
exact test
N of valid 20 - - - -
cases
Figure 9. Egger’s test of wet-to-dry ratio.
Volume 2 Issue 3 (2023) 9 https://doi.org/10.36922/gtm.0379