
Page 14 - GTM-2-3
P. 14
Global Translational Medicine Hydrogen for acute lung injury
species. We assigned the number “1” to represent SD rats studies of W/D, suggesting that the choice of species can
and the number “0” to represent other species. For the meta- cause observed heterogeneity, particularly in the case
analysis, we used restricted maximum likelihood estimation SD rats (P = 0.015 < 0.05, tau = 0.4579, tau = 0.9132;
2
2
(REML) to estimate heterogeneity and used tau statistics to 1 0
2
explain the heterogeneity between studies using Equation II. Figure 8). These findings emphasize the importance of
carefully selecting the appropriate ALI animal model
tau 2 −tau 2 (II) that best aligns with the research hypothesis. Researchers
∆ = 0 1
tau 2 0 should be mindful of the potential differences in ALI
symptoms between animals and humans.
2
Where tau represents the result before meta- 3.8. Influence of language
0
2
regression, tau represents the result after meta-regression, As reported by Song et al. , excluding non-English
0
[39]
and Δ represents heterogeneity between studies. literature may introduce a specific bias. To address this
The results of the meta-analysis revealed that species concern, our study applied Fisher’s exact test to compare the
variations could explain 50% of heterogeneity between included studies in different publication languages, aiming
to assess the impact of language on the results of the meta-
analysis . The result revealed that there was no significant
[40]
difference between the studies published in different
languages (P = 0.30 > 0.05, Table 3). This finding implied
that language is not a likely factor influencing the results
of our meta-analysis and indicates that the publication bias
related to language was not a concern in the present paper.
3.9. Publication bias
Egger’s test was used to analyze the publication bias in
the present paper. As recommended by Sterne et al. ,
[41]
the number of included studies for tests of funnel plot
asymmetry should be more than 10. Therefore, the studies
related to W/D were used to evaluate the publication
bias. The results of Egger’s regression plot indicated the
presence of significant differences between the studies
Figure 6. Effect of hydrogen for tumor necrosis factor-alpha. Weighted
means difference was used to analyze data. 95% confidence interval (P = 0.039 < 0.05, Figure 9). This finding suggests that
(95% CI) was used as effect sizes. The random-effects model was used further analysis is necessary to assess the robustness of the
to pool data. results.
A B C
D E
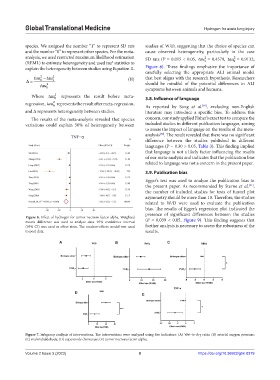
Figure 7. Subgroup analysis of interventions. The interventions were analyzed using five indicators: (A) Wet-to-dry ratio; (B) arterial oxygen pressure;
(C) malondialdehyde; (D) superoxide dismutase; (E) tumor necrosis factor-alpha.
Volume 2 Issue 3 (2023) 8 https://doi.org/10.36922/gtm.0379