
Page 12 - GTM-2-3
P. 12
Global Translational Medicine Hydrogen for acute lung injury
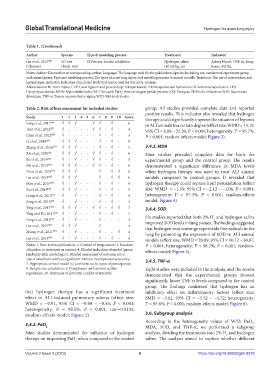
Table 1. (Continued)
Author Species Type & modeling process Treatment Indicator
Liu et al., 2013 SD rats SI Process: Smoke inhalation Hydrogen saline Artery blood: TNF-α↓ Lung
[40]
[Chinese] (Male, 6/6) (10 ml/kg, ip) tissue: MDA↓
Notes: Author: First author or corresponding author; Language: The language used for the publication; Species: Including sex, numbers of experiment group,
and control group; Type and modeling process: The types of acute lung injury and modeling process in animal models; Treatment: The use of intervention and
lasting times; Indicator: Indicators of included study that can be used for this meta-analysis.
Abbreviations: BI: Burn injury; CLP: Cecal ligation and puncture; ip: Intraperitoneal; IH: Intraperitoneal hydration; I/R: Ischemia/reperfusion; LPS:
Lipopolysaccharide; MDA: Malondialdehyde; OA: Oleic acid; PaO : Arterial oxygen partial pressure; PQ: Paraquat; SI: Smoke inhalation; SOD: Superoxide
2
dismutase; TNF-α: Tumor necrosis factor-alpha; W/D: Wet-to-dry ratio.
Table 2. Risk of bias assessment for included studies group. All studies provided complete data and reported
positive results. This indicator also revealed that hydrogen
Study 1 2 3 4 5 6 7 8 9 10 Score therapy could significantly improve the situation of hypoxia
Fang et al., 2011 [26] √ √ √ - - √ √ - √ - 6 in ALI animals to a certain degree (effect size: WMD = 14.19,
Tian et al., 2012 [27] √ - - - - √ √ - √ - 4 95% CI = 6.08 – 22.30, P < 0.001; heterogeneity: I = 95.7%,
2
Chen et al., 2012 [20] √ - - - - - √ - √ - 3 P < 0.001; random-effects model; Figure 3).
Li et al., 2014 [23] √ √ √ - - - √ - √ - 5
Zhang et al., 2016 [21] √ √ √ - - - √ - √ - 5 3.4.3. MDA
Xie et al., 2010 [22] √ √ √ - - √ √ - √ - 6 Nine studies provided complete data for both the
Bu et al., 2015 [28] √ - √ - - √ √ - √ - 5 experimental group and the control group. The results
Shi et al., 2013 [29] √ √ √ - - √ √ - √ - 6 demonstrated a significant difference in MDA levels
Zhou et al., 2018 [37] √ √ √ - - - √ - √ √ 6 when hydrogen therapy was used to treat ALI animal
Liu et al., 2013 [38] √ √ √ - - - √ - √ √ 6 models compared to control groups. It revealed that
Mao et al., 2015 [25] √ - √ - - - √ - √ - 4 hydrogen therapy could repress lipid peroxidation (effect
Xu et al., 2019 [30] √ √ √ - - - √ - √ - 5 size: WMD = −1.59, 95% CI = −2.12 – −1.06, P < 0.001;
2
Liang et al., 2012 [31] √ - √ - - - √ - √ - 4 heterogeneity: I = 97.3%, P < 0.001; random-effects
Song et al., 2016 [32] √ - √ - - - √ - √ - 4 model; Figure 4).
Ying et al., 2017 [33] √ √ √ - - √ √ - √ √ 7 3.4.4. SOD
Ying and He, 2011 [34] √ - √ - - - √ - √ - 4
Fang et al., 2012 [26] √ - √ - - - √ - - - 3 Six studies reported that both 2% H and hydrogen saline
2
Liu et al., 2015 [24] √ √ √ - - - √ - - - 4 improved SOD levels in lung tissues. The findings suggested
that hydrogen may scavenge superoxide free radicals in the
Zhang et al., 2011 [35] √ - √ - - - √ - - √ 4 lung by promoting the expression of SOD in ALI animal
Liu et al., 2013 [36] √ - √ - - - √ - √ - 4 models (effect size: WMD = 20.09, 95% CI = 10.12 – 30.07,
Notes: 1. Peer-review publication; 2. Control of temperature; 3. Random P < 0.001; heterogeneity: I = 98.7%, P < 0.001; random-
2
allocation to treatment or control; 4. Blinded induction of model (group effects model; Figure 5).
randomly after modeling); 5. Blinded assessment of outcome (s); 6.
Use of anesthetic without significant intrinsic neuroprotective activity; 3.4.5. TNF-α
7. Appropriate animal model (s) (conform to the types of participants);
8. Sample size calculation; 9. Compliance with animal welfare Eight studies were included in the analysis, and the results
regulations; 10. Statement of potential conflict of interests. demonstrated that the experimental groups showed
significantly lower TNF-α levels compared to the control
group. The findings confirmed that hydrogen has an
that hydrogen therapy has a significant treatment inhibitory effect on inflammatory factors (effect size:
effect in ALI-induced pulmonary edema (effect size: SMD = −3.62, 95% CI = −5.52 – −1.72; heterogeneity:
WMD = −0.91, 95% CI = −0.98 – −0.85, P < 0.001; I = 93.8%, P < 0.001; random-effects model; Figure 6).
2
heterogeneity: I = 98.5%, P < 0.001, tau =0.9132;
2
2
random-effects model; Figure 2). 3.6. Subgroup analysis
According to the heterogeneity values of W/D, PaO ,
3.4.2. PaO 2
2 MDA, SOD, and TNF-α, we performed a subgroup
Nine studies demonstrated the influence of hydrogen analysis, dividing the treatments into 2% H and hydrogen
2
therapy on improving PaO when compared to the control saline. The analysis aimed to explore whether different
2
Volume 2 Issue 3 (2023) 6 https://doi.org/10.36922/gtm.0379