
Page 43 - GTM-2-3
P. 43
Global Translational Medicine Deep learning by NMR-biochemical
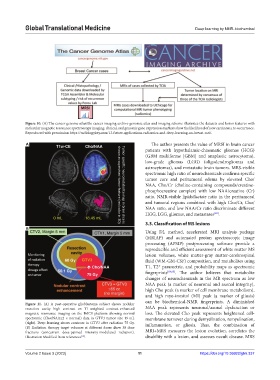
Figure 10. (A) The cancer genome atlas/the cancer imaging archive genomic atlas and imaging scheme illustrates the datasets and lesion features with
molecular magnetic resonance spectroscopy imaging, clinical, and genomic gene expression markers show the likelihood of new carcinoma re-occurrence.
Reproduced with permission https://radiologykey.com/13-future-applications-radiomics-and-deep-learning-on-breast-mri/.
A The author presents the value of MRSI in brain cancer
patients with hypothalamic‑chiasmatic gliomas (HCG)
(GBM multiforme [GBM] and anaplastic astrocytoma),
low‑grade gliomas (LGG) (oligodendrogliomas and
astrocytomas), and metastatic brain tumors. MRS-visible
spectromic high ratio of neurochemicals confirms specific
tumor core and peritumoral edema by elevated Cho/
NAA, Cho/Cr (choline-containing compounds/creatine-
phosphocreatine complex) with low NAA/creatine (Cr)
ratio. NMR-visible lipids/lactate ratio in the peritumoral
and tumoral regions combined with high Cho/Cr, Cho/
NAA ratio, and low NAA/Cr ratio discriminate different
HGG, LGG, gliomas, and metastases .
[63]
3.3. Classification of MS lesions
B
Using DL method, accelerated MRI analysis package
(MRIAP) and automated proton spectroscopic image
processing (APSIP) postprocessing software provide a
reproducible and efficient assessment of white matter MS
lesion volumes, white matter-gray matter-cerebrospinal
fluid (WM‑GM‑CSF) composition, and metabolites using
T1, T2* parametric, and probability maps as spectromic
fingerprints [64,65] . The author believes that metabolite
changes of neurochemicals in the MR spectrum as low
NAA peak (a marker of neuronal and axonal integrity),
high Cho peak (a marker of cell membrane metabolism),
and high myo-inositol (MI) peak (a marker of gliosis)
can be biochemical-NMR fingerprints. A diminished
Figure 11. (A) A post-operative glioblastoma subject shows nodular
resection cavity high contrast on T1-weighted contrast-enhanced NAA peak represents neuronal/axonal dysfunction or
magnetic resonance imaging on the BrICS platform showing normal loss. The elevated Cho peak represents heightened cell-
spectromic (Cho/NAA≥2 × normal) data in GTV3 tumor size 19 mL membrane turnover during demyelination, remyelination,
(right). Deep learning shows contours in GTV3 after radiation 75 Gy. inflammation, or gliosis. Thus, the combination of
(B) Radiation therapy target volumes at different doses show 30 dose
fractions (concurrent dose-painted intensity-modulated radiation). MRI+MRS measures the lesion evolution, correlates the
Illustration Modified from references . disability with a lesion, and assesses occult disease. MRS
[18]
Volume 2 Issue 3 (2023) 11 https://doi.org/10.36922/gtm.337