
Page 40 - GTM-2-3
P. 40
Global Translational Medicine Deep learning by NMR-biochemical
Figure 4. An illustration of multiple-stage spectromics discovery, process, and translation for validation of quantitative imaging features based on the
discovery of new relationships to other “omics” and translation into clinical predictive models as reference “virtual digital biopsies,” similar to actual
biopsies to screen and assess therapeutic response. https://radiologykey.com/13-future-applications-radiomics-and-deep-learning-on-breast-mri/.
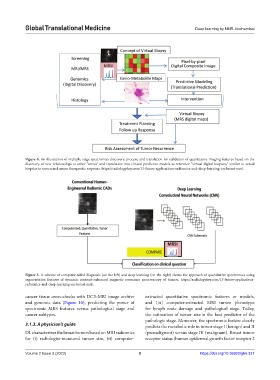
Figure 5. A scheme of computer-aided diagnosis (on the left) and deep learning (on the right) shows the approach of quantitative spectromics using
segmentation features of dynamic contrast-enhanced magnetic resonance spectroscopy of tumors. https://radiologykey.com/13-future-applications-
radiomics-and-deep-learning-on-breast-mri/.
cancer tissue cross-checks with DCE-MRI image archive extracted quantitative spectromic features or models,
and genomic data (Figure 10), predicting the power of and (iii) computer-extracted MRI tumor phenotype
spectromic MRS features versus pathological stage and for lymph node damage and pathological stage. Today,
cancer subtypes. the estimation of tumor size is the best predictor of the
pathologic stage. Moreover, the spectromic feature clearly
3.1.3. A physician’s guide predicts the metabolic role in tumor stage I (benign) and II
DL characterizes the breast tumors based on MRI radiomics (premalignant) versus stage III (malignant). Breast tumor
for (i) radiologist-measured tumor size, (ii) computer- receptor status (human epidermal growth factor receptor 2
Volume 2 Issue 3 (2023) 8 https://doi.org/10.36922/gtm.337