
Page 39 - GTM-2-3
P. 39
Global Translational Medicine Deep learning by NMR-biochemical
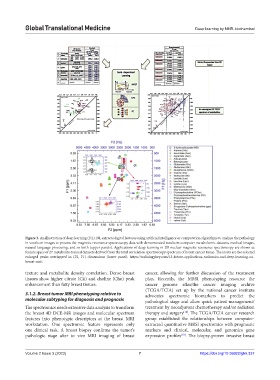
Figure 3. An illustration of deep learning (DL). DL extracts digital features using artificial intelligence or computation algorithms to analyze the pathology
in voxels on images to process the magnetic resonance spectroscopy data with demonstrated results in computer metabolomic datasets, medical images,
natural language processing, and so forth (upper panels). Applications of deep learning in 2D nuclear magnetic resonance spectroscopy are shown as
feature space of 27 metabolite-trained datasets derived from the total correlation spectroscopy spectrum of breast cancer tissue. The insets are the selected
enlarged peaks overlapped in (F2, F1) dimensions (lower panel). https://radiologykey.com/13-future-applications-radiomics-and-deep-learning-on-
breast-mri/.
texture and metabolite density correlation. Dense breast cancer, allowing for further discussion of the treatment
tissues show higher citrate (Cit) and choline (Cho) peak plan. Recently, the MRSI phenotyping resource the
enhancement than fatty breast tissues. cancer genome atlas/the cancer imaging archive
(TCGA/TCIA) set up by the national cancer institute
3.1.2. Breast tumor MRI phenotyping relative to advocates spectromic biomarkers to predict the
molecular subtyping for diagnosis and prognosis pathological stage and allow quick patient management/
The spectromics needs extensive data analysis to transform treatment by neoadjuvant chemotherapy and/or radiation
[18]
the breast 4D DCE-MR images and molecular spectrum therapy and surgery . The TCGA/TCIA cancer research
features into phenotypic descriptors at the breast MRI group established the relationships between computer-
workstation. One spectromic feature represents only extracted quantitative MRSI spectromics with prognostic
one clinical task. A breast biopsy confirms the tumor’s markers and clinical, molecular, and genomics gene
[18]
pathologic stage after in vivo MRI imaging of breast expression profiles . The biopsy-proven invasive breast
Volume 2 Issue 3 (2023) 7 https://doi.org/10.36922/gtm.337