
Page 35 - GTM-2-3
P. 35
Global Translational Medicine Deep learning by NMR-biochemical
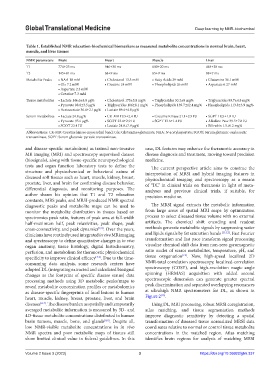
Table 1. Established NMR relaxation‑biochemical biomarkers as measured metabolite concentrations in normal brain, heart,
muscle, and liver tissues
NMR parameters Brain Heart Muscle Liver
T1 774±23 ms 946±30 ms 600±20 ms 448±20 ms
T2 145±81 ms 68±9 ms 65±9 ms 88±7 ms
Metabolite Peaks • NAA 18 mM • Cholesterol 13.5 mM • Fatty Acids 29 mM • Glutamine 36.1 mM
• Glx 7.2 mM • Creatine 24 mM • Phospholipids 26 mM • Aspartate 6.27 mM
• Aspartate 2.3 mM
• Creatine 7.3 mM
Tissue metabolites • Lactate 146.6±8.8 µg% • Cholesterol 175±5.8 mg% • Triglycerides 30.2±8 mg% • Triglycerides 89.7±4.8 mg%
• Pyruvate 98.8±3.5 µg% • Triglycerides 106±8.1 mg% • Phospholipids 139.7±12.4 mg% • Phospholipids 113.8±3.9 mg%
• Acetoacetate 36.6±2.1 µg% • Lactate 89.4±4.8 µg%
Serum metabolites • Lactate 24.8 µg% • CK‑MB 19.5±2.4 IU • Creatine Kinase 21.1±2.9 IU • SGPT 18.5±1.9 IU
• Pyruvate 95.6 µg% • SGOT 23.4±2.9 IU • SGPT 13.6±1.4 IU • Alkaline Pase 39.5±7.8 IU
• SGOT 23.4 IU • Lactate 24.8±7.9 µg% • Bilirubin 1.5±0.2 mg%
Abbreviations: CK‑MB: Creatine kinase‑myocardial band; Glx: Glutamine+glutamate, NAA: N‑acetylaspartate; SGOT: Serum glutamic‑oxaloacetic
transaminase, SGPT: Serum glutamic‑pyruvic transaminase.
and disease-specific metabolism) as trained non-invasive case, DL features may enhance the theranostic accuracy in
MR imaging (MRI) and spectroscopy supervised dataset disease diagnosis and treatment, moving toward precision
(biosignals), along with tissue-specific neuropsychological medicine.
tests and organ function laboratory tests to define the The current perspective article aims to construe the
structure and physiochemical or behavioral nature of interpretation of MRSI and hybrid imaging features in
diseased soft tissues such as heart, muscle, kidney, breast, physiochemical imaging and spectroscopy as a means
prostate, liver, and brain for confirming disease behavior, of “DL” in clinical trials on theranosis in light of meta-
differential diagnosis, and monitoring purposes. The analyses and previous clinical trials, if suitable, for
author shares his opinion that T1 and T2 relaxation precision medicine.
constants, MRS peaks, and MRSI-produced NMR spectral
diagnostic peaks and metabolite maps can be used to The MRSI signal extracts the metabolic information
monitor the metabolite distribution in tissues based on from large areas of spatial MRI maps by optimization
spectromics peak ratio, features of peak area at full-width process to select diseased tissue volume with no external
half-maximum half, peak relaxivities, peak shape, peak artifacts. The chemical shift encoding and readout
cross-connectivity, and peak dynamics [2,3] . Over the years, methods generate metabolite signals by suppressing water
clinicians have routinely used integrated in vivo MR imaging and lipids signals by fat saturation bands [11,12] . Fast Fourier
and spectroscopy to define quantitative changes in in vivo transformation and fast pace transform signal processing
organ anatomy, tissue histology, digital histochemistry, visualize chemical shift data from non-zero gyromagnetic
perfusion, and metabolism for theranostic physiochemical ratio nuclei of scarce metabolites, temperature, pH, and
[12]
specificity to improve clinical efficacy [4-6] . Due to the time- tissue oxygenation . Now, high-speed localized 2D
consuming data analysis, some research centers have NMR-total correlation spectroscopy, localized-correlation
adopted DL (integrating extracted and calculated biosignal spectroscopy (COSY), and high-resolution magic angle
changes as the footprint of specific disease status) data spinning (HRMAS) acquisition with added second
processing methods using 3D metabolic peaks/maps to spectroscopic dimension can generate greater spectral
reveal metabolite concentration profiles or metabolomics peak discrimination and separated overlapping resonances
as disease-specific fingerprints of focal lesions in human at ultrahigh NMR spectrometers for DL, as shown in
[13]
heart, muscle, kidney, breast, prostate, liver, and brain Figure 2 .
diseases [2-7] . The disease burden as spatially and temporarily Using DL, MRI processing, robust MRSI coregistration,
averaged metabolite information is measured by 3D- and atlas matching, and tissue segmentation methods
4D-tissue metabolite concentrations distributed in human improve diagnostic sensitivity by detecting a spatial
brain tumors, muscle, bone, and glands [8,9] . Despite all, transformation of diseased tissue normalized MRSI data
low NMR-visible metabolite concentrations in in vivo coordinates relative to normal or control tissue metabolite
NMR spectra and poor metabolic maps of tissues still concentrations in the matched region. Atlas matching
show limited clinical value in federal guidelines. In this identifies brain regions for analysis of matching MRSI
Volume 2 Issue 3 (2023) 3 https://doi.org/10.36922/gtm.337