
Page 36 - GTM-2-3
P. 36
Global Translational Medicine Deep learning by NMR-biochemical
A
B
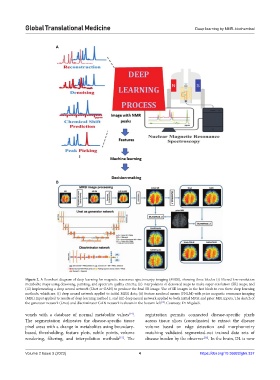
Figure 2. A flowchart diagram of deep learning for magnetic resonance spectroscopy imaging (MRSI), showing three blocks: (i) filtered low-resolution
metabolite maps using denoising, painting, and spectrum quality criteria; (ii) interpolation of denoised maps to make super‑resolution (SR) maps; and
(iii) implementing a deep neural network (Unet or GAN) to produce the final SR image. Use of SR images in the last block to run three deep learning
methods, which are: (i) deep neural network applied to initial MRSI data; (ii) feature nonlocal means (FNLM) with prior magnetic resonance imaging
(MRI) input applied to results of deep learning method I; and (iii) deep neural network applied to both initial MRSI and prior MRI inputs. The sketch of
the generator network (Unet) and discriminator GAN network is shown in the bottom‑left . Courtesy: Dr Migdadi.
[19]
voxels with a database of normal metabolite values . registration permits connected disease-specific pixels
[14]
The segmentation delineates the disease-specific tissue across tissue slices (coordinates) to extract the disease
pixel areas with a change in metabolites using boundary- volume based on edge detection and morphometry
based, thresholding, feature plots, subtle points, volume matching validated segmented-out trained data sets of
rendering, filtering, and interpolation methods . The disease burden by the observer . In the brain, DL is now
[16]
[15]
Volume 2 Issue 3 (2023) 4 https://doi.org/10.36922/gtm.337