
Page 93 - GTM-4-1
P. 93
Global Translational Medicine Brain morphology in obesity
A B C
D
E F
G H I
J K
L
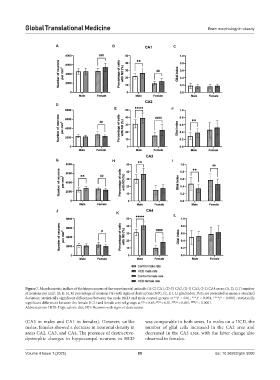
Figure 7. Morphometric indices of the hippocampus of the experimental animals: (A-C) CA1, (D-F) CA2, (G-I) CA3, (J-L) CA4 areas; (A, D, G, J) number
of neurons per mm , (B, E, H, K) percentage of neurons (%) with signs of destruction (ND), (C, F, I, L) glial index. Data are presented as mean ± standard
2
deviation; statistically significant differences between the male HCD and male control groups at **P < 0.01, ***P < 0.001, ****P < 0.0001; statistically
significant differences between the female HCD and female control groups at P < 0.05, P < 0.01, P < 0.001, #### P < 0.0001.
##
#
###
Abbreviations: HCD: High-calorie diet; ND: Neurons with signs of destruction.
(CA3 in males and CA1 in females). However, unlike was comparable in both sexes. In males on a HCD, the
males, females showed a decrease in neuronal density in number of glial cells increased in the CA2 area and
areas CA2, CA3, and CA4. The presence of destructive- decreased in the CA3 area, with the latter change also
dystrophic changes in hippocampal neurons in HCD observed in females.
Volume 4 Issue 1 (2025) 85 doi: 10.36922/gtm.5000