
Page 91 - GTM-4-1
P. 91
Global Translational Medicine Brain morphology in obesity
A B
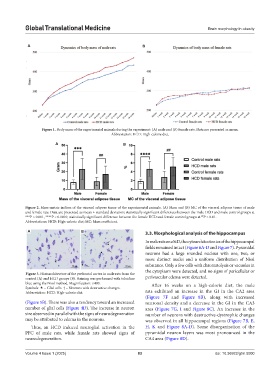
Figure 1. Body mass of the experimental animals during the experiment: (A) male and (B) female rats. Data are presented as mean.
Abbreviation: HCD: High-calorie diet.
A B
Figure 2. Mass-metric indices of the visceral adipose tissue of the experimental animals. (A) Mass and (B) MC of the visceral adipose tissue of male
and female rats. Data are presented as mean ± standard deviation; statistically significant differences between the male HCD and male control groups at
***P < 0.001, ****P < 0.0001; statistically significant difference between the female HCD and female control groups at P < 0.01.
##
Abbreviations: HCD: High-calorie diet; MC: Mass coefficient.
A B 3.3. Morphological analysis of the hippocampus
In male rats on a StD, the cytoarchitectonics of the hippocampal
fields remained intact (Figure 6A-D and Figure 7). Pyramidal
neurons had a large rounded nucleus with one, two, or
more distinct nuclei and a uniform distribution of Nissl
substance. Only a few cells with chromatolysis or vacuoles in
the cytoplasm were detected, and no signs of pericellular or
Figure 3. Histoarchitecture of the prefrontal cortex in male rats from the
control (A) and HCD groups (B). Staining was performed with toluidine perivascular edema were detected.
blue using the Nissl method. Magnification: ×400. After 16 weeks on a high-calorie diet, the male
Symbols: – Glial cells. ↑ – Neurons with destructive changes.
Abbreviation: HCD: High-calorie diet. rats exhibited an increase in the GI in the CA2 area
(Figure 7F and Figure 8B), along with increased
(Figure 5B). There was also a tendency toward an increased neuronal density and a decrease in the GI in the CA3
number of glial cells (Figure 4D). The increase in neuron area (Figure 7G, I and Figure 8C). An increase in the
size observed in parallel with the signs of neurodegeneration number of neurons with destructive-dystrophic changes
may be attributed to edema in the neurons. was observed in all hippocampal regions (Figure 7B, E,
Thus, an HCD induced neuroglial activation in the H, K and Figure 8A-D). Some disorganization of the
PFC of male rats, while female rats showed signs of pyramidal neuron layers was most pronounced in the
neurodegeneration. CA4 area (Figure 8D).
Volume 4 Issue 1 (2025) 83 doi: 10.36922/gtm.5000