
Page 92 - GTM-4-1
P. 92
Global Translational Medicine Brain morphology in obesity
A B
C D
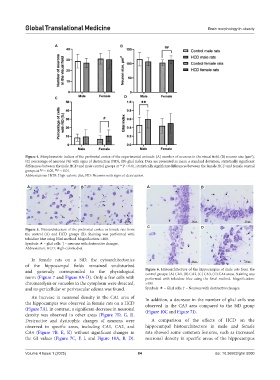
Figure 4. Morphometric indices of the prefrontal cortex of the experimental animals: (A) number of neurons in the visual field, (B) neuron size (μm ),
2
(C) percentage of neurons (%) with signs of destruction (ND), (D) glial index. Data are presented as mean ± standard deviation; statistically significant
differences between the male HCD and male control groups at **P < 0.01; statistically significant differences between the female HCD and female control
groups at P < 0.05, P < 0.01.
##
#
Abbreviations: HCD: High-calorie diet; ND: Neurons with signs of destruction.
A B A B
C D
Figure 5. Histoarchitecture of the prefrontal cortex in female rats from
the control (A) and HCD groups (B). Staining was performed with
toluidine blue using Nissl method. Magnification: ×400.
Symbols: – glial cells. ↑ – neurons with destructive changes.
Abbreviation: HCD: High-calorie diet.
In female rats on a StD, the cytoarchitectonics
of the hippocampal fields remained undisturbed
and generally corresponded to the physiological Figure 6. Histoarchitecture of the hippocampus of male rats from the
control groups: (A) CA1, (B) CA2, (C) CA3, (D) CA4 areas. Staining was
norm (Figure 7 and Figure 9A-D). Only a few cells with performed with toluidine blue using the Nissl method. Magnification:
chromatolysis or vacuoles in the cytoplasm were detected, ×400.
and no pericellular or perivascular edema was found. Symbols: – Glial cells. ↑ – Neurons with destructive changes.
An increase in neuronal density in the CA1 area of In addition, a decrease in the number of glial cells was
the hippocampus was observed in female rats on a HCD observed in the CA3 area compared to the StD group
(Figure 7A). In contrast, a significant decrease in neuronal (Figure 10C and Figure 7I).
density was observed in other areas (Figure 7D, G, J).
Destructive and dystrophic changes of neurons were A comparison of the effects of HCD on the
observed in specific areas, including CA1, CA2, and hippocampal histoarchitecture in male and female
CA4 (Figure 7B, E, K) without significant changes in rats showed some common features, such as increased
the GI values (Figure 7C, F, L and Figure 10A, B, D). neuronal density in specific areas of the hippocampus
Volume 4 Issue 1 (2025) 84 doi: 10.36922/gtm.5000