
Page 212 - IJB-10-1
P. 212
International Journal of Bioprinting CS-laden microporous bio-ink for cartilage regeneration
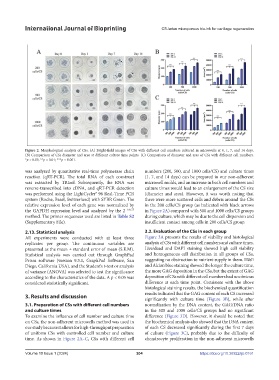
Figure 2. Morphological analysis of CSs. (A) Bright-field images of CSs with different cell numbers cultured in microwells at 0, 1, 7, and 14 days.
(B) Comparison of CSs diameter and area at different culture time points. (C) Comparison of diameter and area of CSs with different cell numbers.
*p < 0.05; **p < 0.01; ***p < 0.001.
was analyzed by quantitative real-time polymerase chain numbers (200, 500, and 1000 cells/CS) and culture times
reaction (qRT-PCR). The total RNA of each construct (1, 7, and 14 days) can be prepared in our non-adherent
was extracted by TRIzol. Subsequently, the RNA was microwell molds, and an increase in both cell numbers and
reverse-transcribed into cDNA, and qRT-PCR detection culture times would lead to an enlargement of the CS size
was performed using the LightCycler® 96 Real-Time PCR (diameter and area). However, it was worth noting that
system (Roche, Basel, Switzerland) with SYBR Green. The there were more scattered cells and debris around the CSs
relative expression level of each gene was normalized by in the 200 cells/CS group (as indicated with black arrows
the GAPDH expression level and analyzed by the 2 - ΔΔCT in Figure 2A) compared with 500 and 1000 cells/CS groups
method. The primer sequences used are listed in Table S2 during culture, which may be due to the cell dispersion and
(Supplementary File). insufficient contact among cells in 200 cells/CS group.
2.13. Statistical analysis 3.2. Evaluation of the CSs in each group
All experiments were conducted with at least three Figure 3A presents the results of viability and histological
replicates per group. The continuous variables are analysis of CSs with different cell numbers and culture times.
presented as the mean ± standard error of mean (S.E.M). Live/dead and DAPI staining showed high cell viability
Statistical analysis was carried out through GraphPad and homogeneous cell distribution in all groups of CSs,
Prism software (version 9.3.1, GraphPad Software, San suggesting no obstruction to nutrient supply in them. H&E
Diego, California USA), and the Student’s t-test or analysis and Alcian blue staining showed the longer the culture time,
of variance (ANOVA) was selected to test the significance the more GAG deposition in the CSs, but the extent of GAG
according to the characteristics of the data. A p < 0.05 was deposition of CSs with different cell numbers had no obvious
considered statistically significant. difference at each time point. Consistent with the above
histological staining results, the biochemical quantification
3. Results and discussion results indicated that the GAG content of each CS increased
significantly with culture time (Figure 3B), while after
3.1. Preparation of CSs with different cell numbers normalization by the DNA content, the GAG/DNA ratio
and culture times in the 500 and 1000 cells/CS groups had no significant
To examine the influence of cell number and culture time difference (Figure 3D). However, it should be noted that
on CSs, the non-adherent microwells method was used in the biochemical analysis also showed that the DNA content
our study because it allows for high-throughput preparation of each CS decreased significantly during the first 7 days
of uniform CSs with controlled cell number and culture of culture (Figure 3C), probably due to the difficulty of
time. As shown in Figure 2A–C, CSs with different cell chondrocyte proliferation in the non-adherent microwells
Volume 10 Issue 1 (2024) 204 https://doi.org/10.36922/ijb.0161