
Page 211 - IJB-10-1
P. 211
International Journal of Bioprinting CS-laden microporous bio-ink for cartilage regeneration
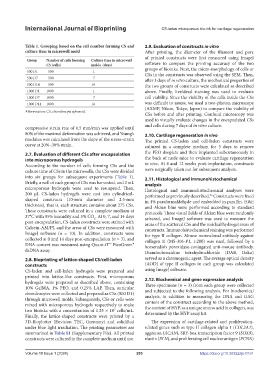
Table 1. Grouping based on the cell number forming CS and 2.9. Evaluation of constructs in vitro
culture time in microwell mold After printing, the diameter of the filament and pore
of printed constructs were first measured using ImageJ
Group Number of cells forming Culture time in microwell
CS (cells) molds (days) software to compare the printing accuracy of the two
500 D1 500 1 groups of bioinks. Next, the micro-morphology of cells or
CSs in the constructs was observed using the SEM. Then,
500 D7 500 7 after 3 days of in vitro culture, the mechanical properties of
500 D14 500 14 the two groups of constructs were calculated as described
1000 D1 1000 1 above. Finally, live/dead staining was used to evaluate
1000 D7 1000 7 cell viability. Since the viability of the cells inside the CSs
1000 D14 1000 14 was difficult to assess, we used a two-photon microscope
(AXMP, Nikon, Tokyo, Japan) to compare the viability of
Abbreviation: CS, chondrocyte spheroid.
CSs before and after printing. Confocal microscopy was
used to visually evaluate changes in the encapsulated CSs
compressive strain rate of 0.5 mm/min was applied until and cells during 7 days of in vitro culture.
80% of the maximal deformation was achieved, and Young’s 2.10. Cartilage regeneration in vivo
modulus was calculated from the slope of the stress–strain The printed CS-laden and cell-laden constructs were
curve at 20%–30% strain. cultured in a complete medium for 3 days to remove
2.7. Evaluation of different CSs after encapsulation the PEO droplets and then implanted subcutaneously in
into microporous hydrogels the back of nude mice to evaluate cartilage regeneration
According to the number of cells forming CSs and the in vivo. At 4 and 12 weeks post-implantation, constructs
culture time of CSs in the microwells, the CSs were divided were surgically taken out for subsequent analysis.
into six groups for subsequent experiments (Table 1). 2.11. Histological and immunohistochemical
Briefly, a well of each group of CSs was harvested, and 2 mL analysis
microporous hydrogels were used to resuspend. Then, Histological and immunohistochemical analyses were
200 μL CS-laden hydrogels were cast into cylindrical- performed as previously described. Constructs were fixed
26
shaped constructs (10-mm diameter and 2.5-mm in 4% paraformaldehyde and embedded in paraffin. H&E
thickness), that is, each structure contains about 275 CSs. and Alcian blue were performed according to standard
These constructs were cultured in a complete medium at protocols. Three visual fields of Alcian blue were randomly
37°C with 95% humidity and 5% CO . At 0, 7, and 14 days selected, and ImageJ software was used to measure the
2
post-encapsulation, CS-laden constructs were stained with areas of the scattered CSs and the residual hydrogel areas of
Calcein-AM/PI, and the areas of CSs were measured with constructs. Immunohistochemical staining was performed
ImageJ software (n = 10). In addition, constructs were for type II collagen. Mouse monoclonal antibody against
collected at 0 and 14 days post-encapsulation (n = 3), and collagen II (MS-306-P1, 1:200) was used, followed by a
DNA content was measured using Quant-iT™ PicoGreen® horseradish peroxidase-conjugated anti-mouse antibody.
dsDNA assay. Diaminobenzidine tetrahydrochloride (DAB, Dako)
2.8. Bioprinting of lattice-shaped CS/cell-laden served as a chromogenic agent. The average optical density
constructs (AOD) of type II collagen in each group was calculated
CS-laden and cell-laden hydrogels were prepared and using ImageJ software.
printed into lattice-like constructs. First, microporous 2.12. Biochemical and gene expression analysis
hydrogels were prepared as described above, containing Three specimens (n = 3) from each group were collected
10% GelMA, 1% PEO, and 0.25% LAP. Then, auricular and subjected to the following analysis. For biochemical
chondrocytes were collected and prepared as CSs (500 D1) analysis, in addition to measuring the DNA and GAG
through microwell molds. Subsequently, CSs or cells were content of the construct according to the above method,
mixed with microporous hydrogels respectively to make the content of HYP, as a unique amino acid in collagen, was
two bioinks with a concentration of 1.25 × 10 cells/mL. determined by the HYP assay kit.
7
Finally, the lattice-shaped constructs were printed by a
3D-Bioplotter (Envision TEC, Germany) and solidified The expression of cartilage-related and proliferation-
under blue light irradiation. The printing parameters are related genes such as type II collagen alpha 1 (COL2A1),
summarized in Table S1 (Supplementary File). All printed aggrecan (ACAN), SRY-box transcription factor 9 (SOX9),
constructs were cultured in the complete medium until use. elastin (ELN), and proliferating cell nuclear antigen (PCNA)
Volume 10 Issue 1 (2024) 203 https://doi.org/10.36922/ijb.0161